

- Pandas DataFrame Is a Two-Dimensional Labeled Table
- How a DataFrame Organizes Data
- How to Create a Pandas DataFrame
- How to Select Data in a DataFrame
- Core Data Manipulation Tasks
- Handling Missing Data in a DataFrame
- When and How to Reshape the Layout
- Why DataFrames Matter in Python Workflows
- FAQ
- Conclusion
We use a pandas dataframe when we need a table in Python that behaves like data, not just like nested lists. It stores values in rows and columns, keeps labels attached to both axes, and gives us built-in tools for selecting, cleaning, combining, and summarizing information. That makes it one of the fastest ways to move from raw files to useful analysis. If you already think in spreadsheets or SQL tables, you are already close to how a DataFrame works.
Pandas DataFrame Is a Two-Dimensional Labeled Table
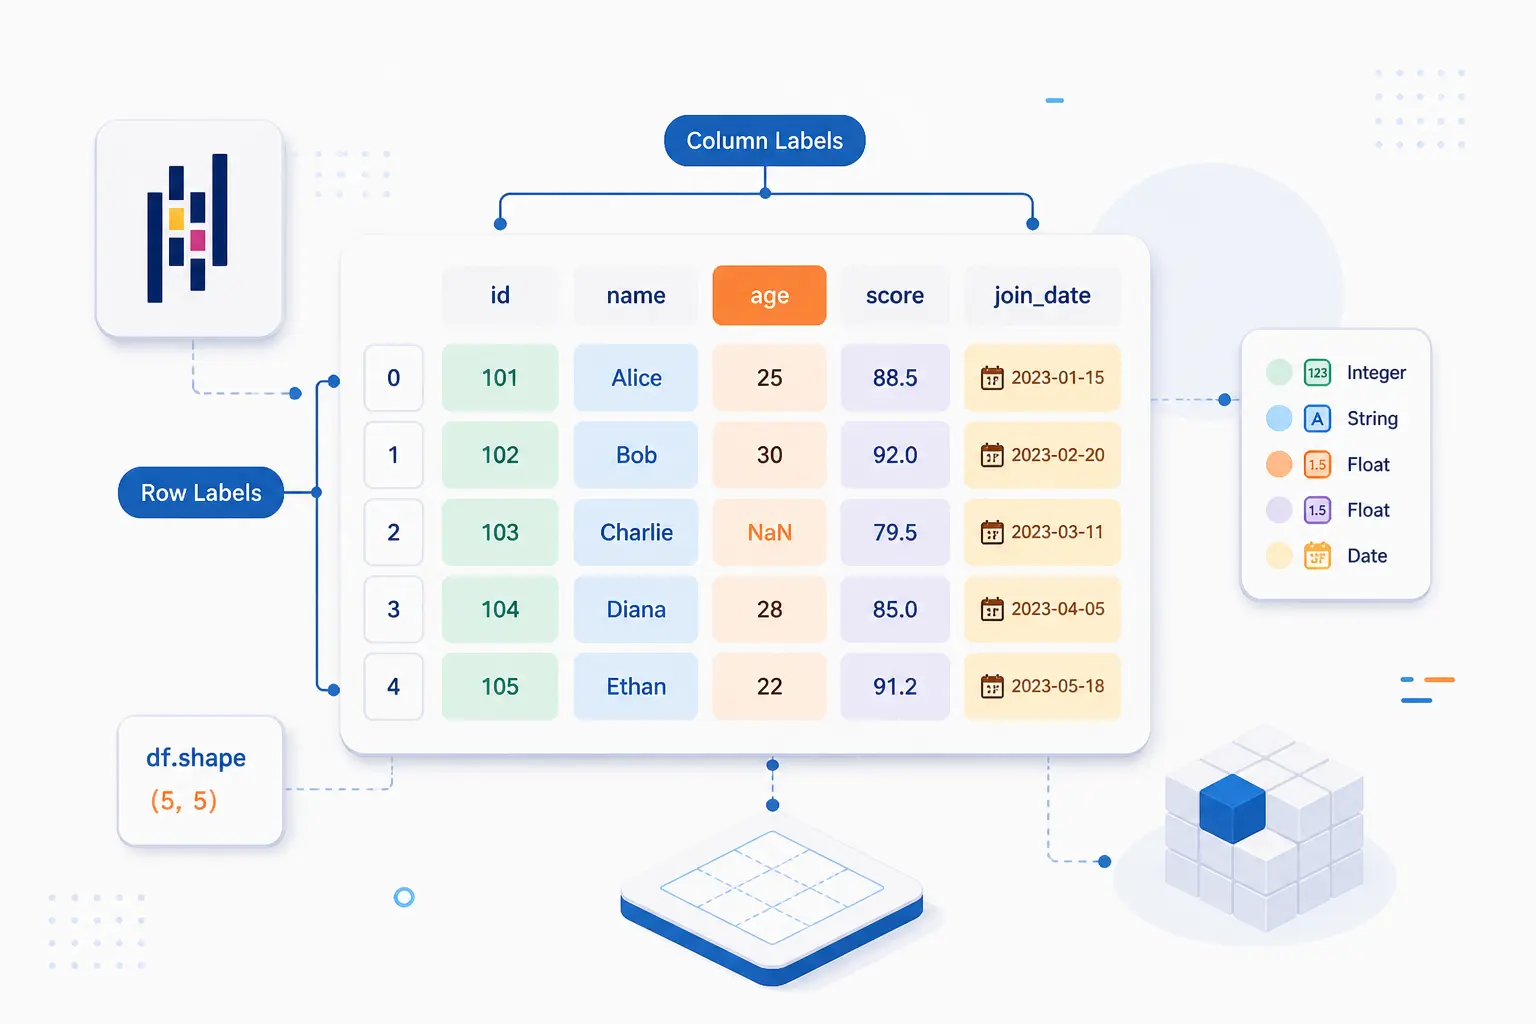
A pandas dataframe is a table-like Python object with named rows and named columns. In the official docs, pandas describes it as a two-dimensional labeled structure whose columns can hold different data types. We think that is the key idea beginners should keep in their head. It looks like a spreadsheet, behaves well with Python code, and is far easier to analyze than raw lists or dictionaries once the data gets even a little messy.
For example, a small sales table might have an order_id column with integers, a state column with strings, and a total column with decimals. A NumPy array wants uniform types. A DataFrame does not. That flexibility is why it became the everyday workhorse for Python data analysis.
FURTHER READING: |
| 1. What Are AI Tokens and How Do They Affect AI Use |
| 2. What Is AI IoT? How Smart Devices Learn and Act |
| 3. AI Impact on Marketing Guide for Smarter Growth |
How a DataFrame Organizes Data
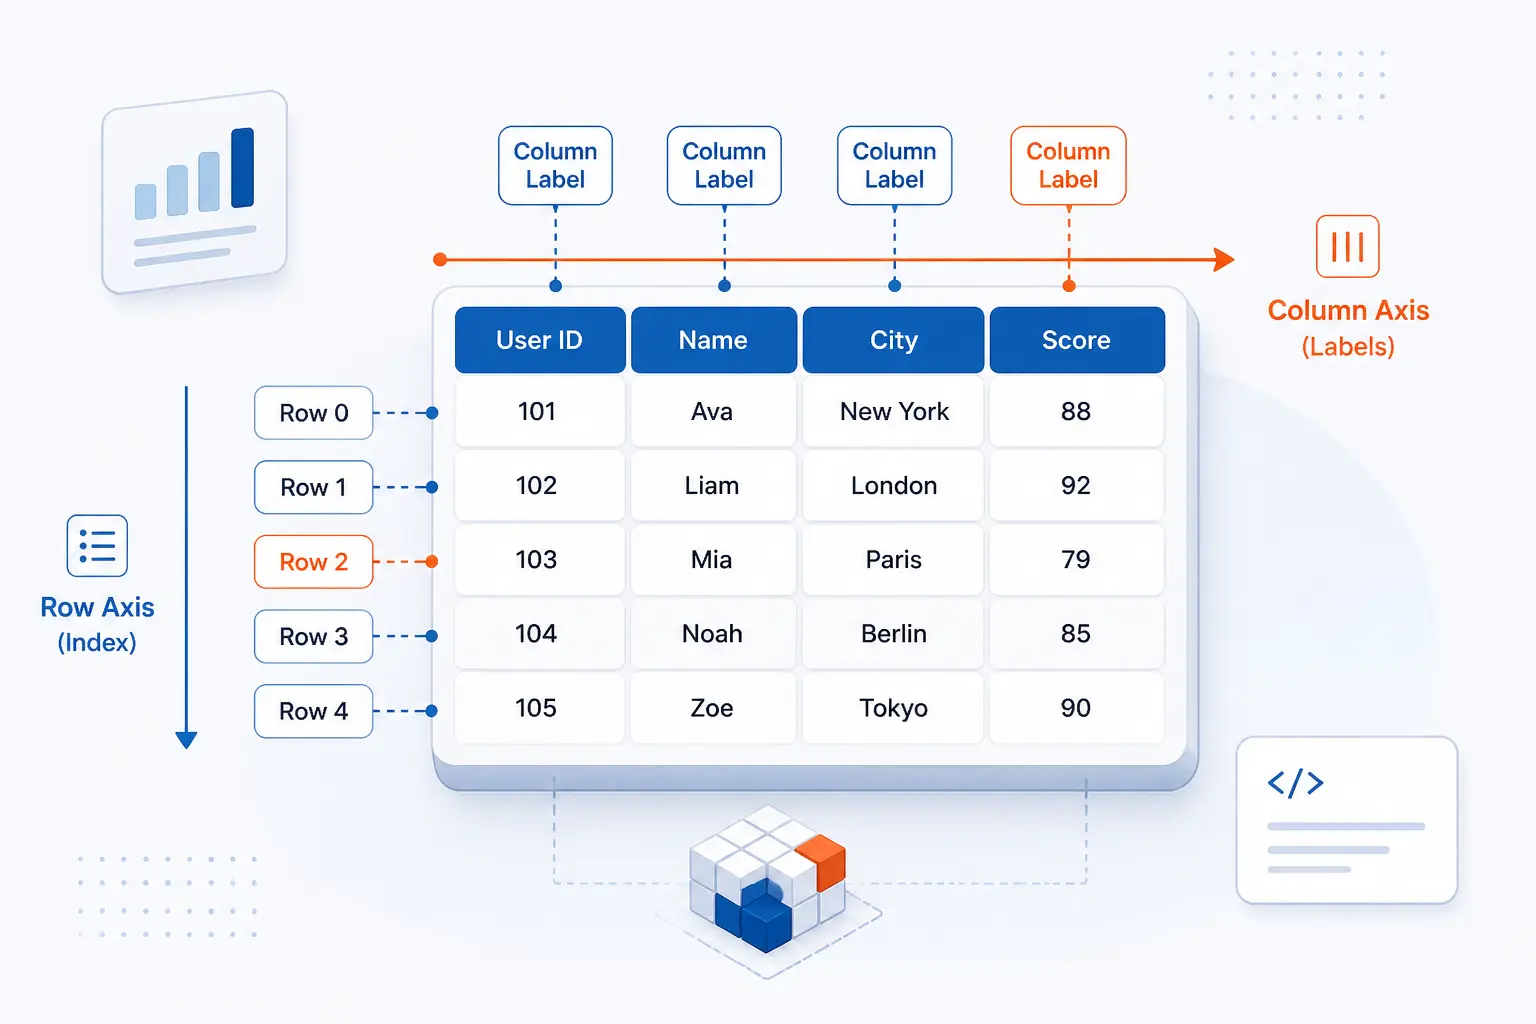
A DataFrame organizes data around axes, labels, and column-wise types. Rows usually represent records, columns usually represent variables, and pandas keeps those labels attached during many operations. That label-aware behavior is what separates a DataFrame from a plain array. In our view, once you understand the axes, the rest of pandas starts to feel much less mysterious.
Rows Columns and Labeled Axes
Rows hold records, columns hold fields, and the two labeled axes make the table easy to navigate. If you are storing website logs, one row might be a single request, while columns store the timestamp, status code, route, and response time. Pandas calls the row axis the index and the column axis the columns. Because both axes are labeled, operations can line up data by names instead of by position alone.
Index Labels Column Names and Data Types
The index identifies rows, column names identify fields, and each column keeps its own data type. That means a single table can mix text, numbers, dates, and booleans without collapsing into one generic type, which the dtypes property makes easy to inspect. This matters in real work. Dates sort and filter differently from strings, and numeric columns can be summed or averaged without extra conversion.
Beginners often ignore the index at first. That is fine. Still, once your row labels carry meaning, such as customer IDs or timestamps, the index becomes a real tool rather than background detail.
Shape Size and Dimensionality
A DataFrame is always two-dimensional, even when it has only one column. Its row and column counts live in the shape attribute, which returns a tuple like (1000, 12). That simple check is one of the quickest sanity tests in analysis. We use it constantly after loading a file, filtering rows, or merging tables.
Size answers a different question. It tells you how many total elements are in the table. Dimensionality, by contrast, tells you the structure. When you mix those up, debugging gets harder than it needs to be.
How It Relates to a Series
A Series is a single labeled column, while a DataFrame is a collection of aligned columns. You can think of a Series as one dimension and a DataFrame as the table built from many Series that share an index. If you select one column from a DataFrame, pandas often returns a Series. That relationship explains a lot of pandas behavior, especially when selecting, assigning, and aligning data.
How to Create a Pandas DataFrame

You create a pandas dataframe by passing structured data into pd.DataFrame() or by reading data from a file or database. Most beginners start with dictionaries or lists because they are easy to see and easy to test. In practice, we create DataFrames from whatever form the data already lives in. The right input is usually the one that needs the least cleanup before analysis.
| Input form | Best use | Typical example |
|---|---|---|
| Dictionary or Series | Column-oriented data already in Python | {"sales": [10, 20]} |
| List, array, or records | Row-oriented data or generated values | [{"city": "Austin", "sales": 20}] |
| File or existing table | Real datasets from CSV, Parquet, SQL, and more | pd.read_csv(...) |
From Dictionaries and Series
Dictionaries are the clearest starting point because keys become column names and values become column data. If you already have Python lists for each field, this is often the most readable option. It also mirrors how many people already think about tabular data.
import pandas as pddf = pd.DataFrame({ "city": ["Boston", "Austin", "Denver"], "sales": [120, 95, 140], "active": [True, True, False]})You can also build a DataFrame from Series objects. That is useful when each column has its own index or arrives from a separate calculation. Pandas will align them by label, which is convenient when done on purpose and confusing when done by accident.
From Lists NumPy Arrays and Records
Lists, arrays, and record-style objects work well when your data already exists row by row. A list of dictionaries is especially friendly for JSON-like data or API responses. A two-dimensional NumPy array works too, but then you usually need to supply column names yourself. We generally prefer record-style input when we want the data to stay readable in code.
rows = [ {"order_id": 101, "total": 29.90}, {"order_id": 102, "total": 15.50}]df = pd.DataFrame(rows)From Files and Existing DataFrames
Most production DataFrames come from files, object storage, or databases, and pandas supports all of those through its I/O reference. That includes readers for CSV, Excel, SQL, JSON, Parquet, and other formats. If we are analyzing application logs or billing exports, this is usually where the work starts. You can also create a new table from an existing one by selecting columns, filtering rows, or copying the original before further changes.
How to Select Data in a DataFrame
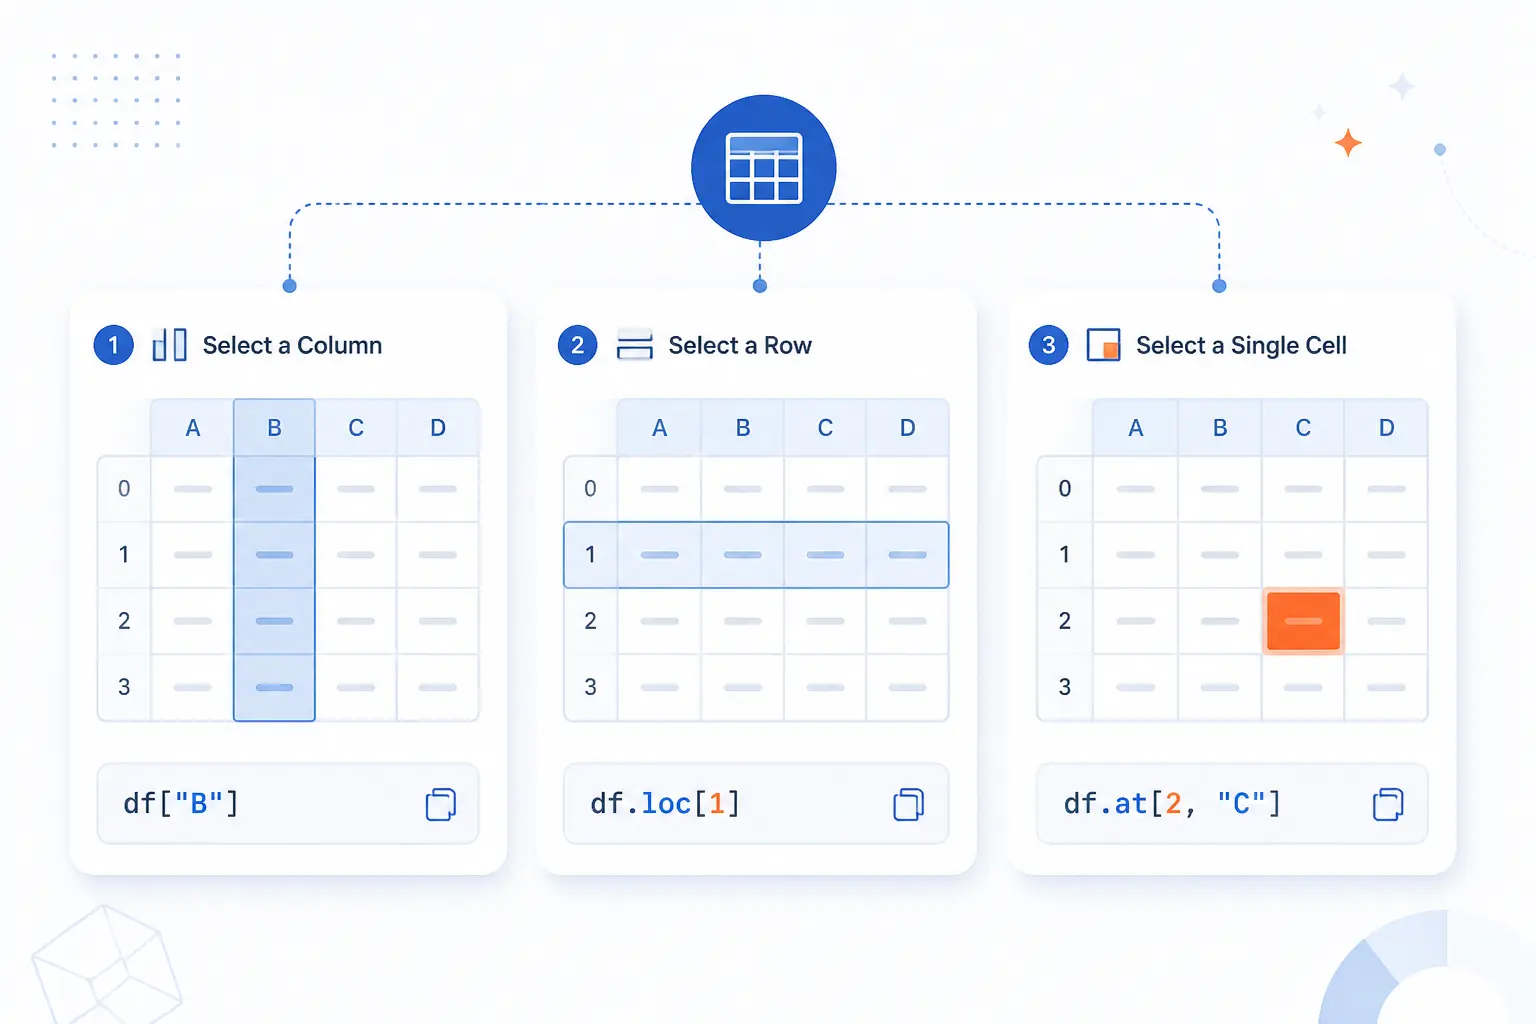
You select data in a DataFrame with column brackets, label-based access, or position-based access. This is the part that trips up many beginners because pandas offers several tools that look similar at first. The good news is that each one has a clear job. Once you match the tool to the question, selection becomes much easier.
| Tool | Best for | Example |
|---|---|---|
[] | Quick column selection | df["sales"] |
loc | Labels and named indexes | df.loc["TX"] |
iloc, at, iat | Positions and single values | df.iloc[0, 1] |
Pick Columns With Brackets
Brackets are the usual way to select columns. Use df["sales"] for one column and df[["sales", "city"]] for several. One bracket returns a Series, while double brackets return a DataFrame. That difference matters because later methods may behave differently on each object type.
Retrieve Rows With loc
loc retrieves data by labels, not by integer position. If your index contains customer IDs, dates, or state abbreviations, loc lets you ask for those labels directly. This makes your code read closer to the data itself. It is also the right choice when you want both row and column selection in one statement, such as df.loc[df["sales"] > 100, ["city", "sales"]].
Use iloc iat and at for Positions and Single Values
iloc is position-based, while at and iat are the fast tools for a single scalar lookup, as the indexing guide explains. Use iloc when you mean “first row” or “third column,” regardless of labels. Use at when you know a row label and column label. Use iat when you know both positions.
This is a practical rule we teach often. If your code cares about names, use label-based access. If it cares about slot number, use position-based access.
Set and Use Named Indexes
A named index turns an ordinary column into the row label, which makes label-based selection more meaningful. If you set customer_id or date as the index, row selection becomes cleaner and joins often make more sense. This is especially useful for time series and lookup tables. Just remember that indexes are powerful only when the labels carry real meaning and stay reasonably unique.
Core Data Manipulation Tasks

Core DataFrame work usually means changing structure, filtering records, computing results, and combining tables. These are the tasks that turn raw input into something you can trust and analyze. In our experience, most business analysis lives here. You rarely need advanced tricks before you need clean columns, clear filters, and correct joins.
Add Remove and Rename Rows or Columns
You add, remove, and rename columns constantly in pandas. New columns often come from expressions like df["tax"] = df["total"] * 0.1. Columns can be dropped with drop() and renamed with rename(). Row changes are possible too, but we usually encourage column-wise operations because they are clearer and fit pandas better.
Filter Query and Format Values
Filtering keeps the rows you care about and discards the rest. The most common pattern uses boolean conditions, such as df[df["status"] == "paid"]. You can also use query() when the condition reads more naturally as an expression. Formatting values often follows filtering, especially for dates, strings, or rounded outputs that need to look right in a report.
Apply Functions and Summarize Results
You summarize data with methods like sum(), mean(), value_counts(), and grouped aggregations. When column-wise formulas are enough, vectorized expressions are usually the cleanest path. apply() is helpful, but we think beginners often reach for it too early. If a built-in method exists, use that first because it is usually clearer and often faster.
Iterate Through Rows and Columns
You can iterate through a DataFrame, but you should treat row iteration as the exception, not the default. Pandas notes in its iteration notes that iterrows() returns each row as a Series, does not preserve dtypes across rows, and is generally slower than itertuples() for row-wise iteration. If you only need to transform columns, vectorized operations are usually the better fit. That is one of the biggest mindset shifts from ordinary Python loops.
Join Merge and Compare Tables
Use joins and merges when one table does not contain the full story. An orders table may hold customer_id, while a second table maps that ID to a region or plan type. Pandas supports SQL-style joins, concatenation, and comparison tools in its merge guide. This is where labels and keys stop being theory and start deciding whether your result is correct.
Handling Missing Data in a DataFrame

Missing data is normal in real datasets, and pandas gives you direct tools to detect, fill, interpolate, and drop those gaps. That matters because blank cells are not just messy. They can quietly change counts, averages, and joins if you ignore them. The official missing-data guide is worth trusting here because the details vary by data type.
Check for Null Values With isnull and notnull
isnull() and isna() mark missing values, while notnull() and notna() mark present ones. These methods return boolean masks, so they work well for counting gaps or filtering incomplete rows. A common first check is df.isnull().sum(). That gives you a quick column-by-column view of where the trouble sits.
Fill Replace and Interpolate Gaps
Use fillna() when you know the replacement rule and interpolate() when values should be estimated from nearby points. Filling with zero can make sense for missing counts. Forward-fill can make sense for repeated labels or slowly changing categories. Interpolation fits ordered numeric data better, such as sensor readings or time-based metrics. The trick is to choose a method that matches the meaning of the missing value, not just the syntax that makes it disappear.
Drop Incomplete Rows or Columns
Drop missing data only when those gaps truly make the row or column unusable. dropna() is fast and convenient, but it can remove more information than you expected. We usually check how much would be lost before dropping anything. One missing ZIP code is different from a row with no usable business fields at all.
When and How to Reshape the Layout

Reshaping changes the table layout so the data matches the task you want to do next. A chart may want wide data, while a group summary or machine learning step may want long data. This is not cosmetic. Layout affects which operations are easy, readable, and correct. The pandas reshape tutorial shows that clearly.
| Tool | Use it when | Result |
|---|---|---|
pivot / pivot_table | You want category summaries in columns | Long to wide or aggregated summary |
stack / unstack | You need to move index levels between axes | MultiIndex reshaping |
melt | You need tidy long-form data | Wide to long |
Pivot and Spreadsheet-Style Summaries
pivot() reorganizes values into a new row and column layout, while pivot_table() also aggregates. If you want sales by month across columns and region down the rows, pivoting is the natural move. This feels familiar to spreadsheet users because it mirrors a pivot table. The important difference is that pandas makes the transformation part of your code, so it stays repeatable.
Stack Unstack and Melt Data
stack(), unstack(), and melt() change whether values live across columns or down rows. melt() is especially useful when a wide table has many repeated measurement columns, such as sales_jan, sales_feb, and sales_mar. Long-form data often works better for grouping, plotting, and cleaner pipelines. If a table feels awkward to analyze, the layout may be the real problem.
Why DataFrames Matter in Python Workflows
DataFrames matter because they give Python a practical tabular core. They sit in the middle between raw files, custom Python code, and downstream analysis. For many teams, that middle layer is where clarity is won or lost. We think that is why the DataFrame keeps showing up in notebooks, scripts, ETL jobs, and reporting pipelines.
Built for Data Manipulation and Analysis
A DataFrame is built for the boring but essential work of analysis. It lets you sort, filter, group, summarize, reshape, and merge without inventing custom table logic from scratch. That lowers friction when the real task is understanding the data, not managing containers. It also makes your steps easier to read later, which matters more than people admit.
Works With Many Data Sources and Formats
DataFrames fit naturally into mixed data environments. You can read exports from a billing tool, query a database, pull parquet files from object storage, and still land in the same table interface. That consistency matters when workflows span scripts, notebooks, and scheduled jobs. One object model across many inputs is a very practical advantage.
Supports Reusable Python Functions and Fast Exploration
DataFrames work well with ordinary Python functions, which makes analysis repeatable instead of one-off. You can write one function to clean columns, another to calculate metrics, and a third to build a summary table. At the same time, the object is interactive enough for quick exploration in a notebook or shell. That mix of structure and speed is hard to beat for everyday data work.
FAQ
Most beginner questions about a pandas dataframe come down to creation, selection, and whether the library is still worth learning. The short answer is yes. If you can create a table, select by label or position, and handle missing values, you already understand the foundation. The rest is mainly practice and pattern recognition.
How Do You Create a Pandas DataFrame?
You create one by passing structured data to pd.DataFrame() or by reading a file with a pandas reader like read_csv(). Dictionaries, lists of records, Series objects, and arrays are all common starting points. In real projects, file and database readers are usually the most common entry point.
How Do loc and iloc Differ in a DataFrame?
loc selects by label, while iloc selects by integer position. Use loc when the row names or column names matter. Use iloc when you mean “first,” “second,” or “third,” regardless of labels.
What Is the Difference Between a DataFrame and a Series?
A Series is one labeled dimension, while a DataFrame is a labeled table with rows and columns. A single column taken from a DataFrame often becomes a Series. If a DataFrame is the spreadsheet, a Series is one field from that sheet.
Are Pandas Difficult to Learn?
No, pandas are not hard to start with, but the indexing model can confuse beginners. Most people learn the basics quickly once they understand columns, loc, iloc, and missing values. The steep part is usually not syntax. It is learning to think in column-wise operations instead of loops.
Are Pandas Still Used?
Yes, pandas is still widely used. In the 2024 Python survey, 80% of respondents involved in data exploration and processing reported using pandas. That does not mean it is the only option, but it does mean the library remains firmly in the mainstream for day-to-day analysis.






Conclusion
A pandas dataframe is, at heart, a labeled table for Python. That sounds simple because it is simple. The power comes from what that table can do once your data is inside it: select by name, clean gaps, compute summaries, join related records, and reshape the result for the next step.
If you are learning pandas now, our advice is plain. Build one small table by hand, then load one real CSV and repeat the same operations. Which part of your current spreadsheet or report would you try turning into a DataFrame first?