
- What Is CRM Reporting?
- CRM Reports vs CRM Dashboards
- Why CRM Reporting Matters for Business Growth
- How CRM Reporting Works
- Essential CRM Reporting Examples Every Team Should Track
- CRM Reporting Metrics That Matter Most
- How to Set Up CRM Reporting the Right Way
- Key Features to Look For in CRM Reporting Tools
- Common CRM Reporting Challenges and How to Fix Them
- How AI Is Making CRM Reporting Smarter
- FAQ About CRM Reporting
- CRM Reporting Takeaways
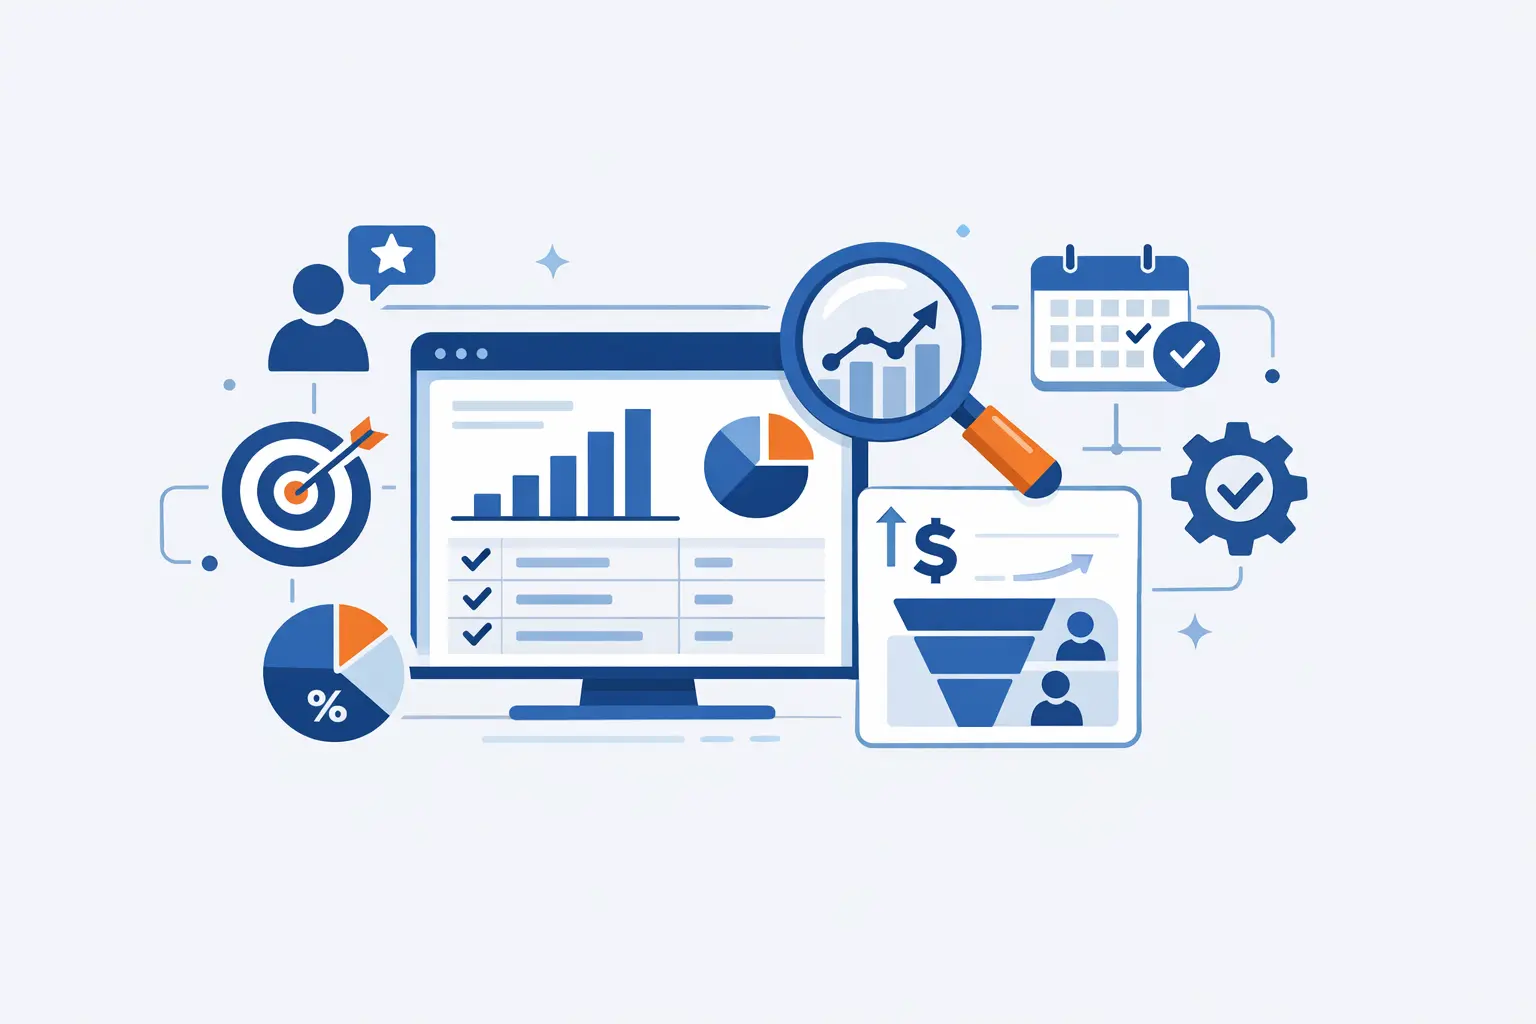
CRM reporting is where customer data stops being a pile of fields and starts becoming a management system. At 1Byte, we see it as the bridge between daily activity and executive judgment, because sales calls, campaign clicks, support tickets, and renewal signals only matter when they can be read in context. When that bridge is weak, teams work hard but still steer by instinct.
The market tells the same story. Gartner says the broader CRM software market grew 13.4% to $128 billion in 2024, which, in our view, is a clear sign that reporting is no longer a side feature but part of the operating core for growth, retention, and planning.
What Is CRM Reporting?
Before we compare reports, dashboards, and AI features, we need a clean definition. In practice, CRM reporting is less about exporting data and more about building a reliable way to answer business questions with evidence rather than guesswork.
1. CRM Reporting Definition and Purpose
At its simplest, CRM reporting is the process of collecting, organizing, and presenting data from your customer relationship management system so teams can understand performance. A good CRM report does not merely list records; it frames a question such as which deals are stalling, which lead sources convert, or which accounts show churn risk. Instead of drowning people in raw entries, it gives them a structured view they can act on.
2. How CRM Reporting Turns Data Into Actionable Insights
Useful CRM reporting turns events into signals. Once fields are standardized, stages are defined, and ownership rules are clear, the system can reveal trends, bottlenecks, and unusually strong outcomes that would stay hidden in a spreadsheet. Vendor case studies are not universal proof, but they can still illustrate the point: HubSpot highlighted Rever, whose team said clearer CRM and reporting visibility supported better cross-functional understanding as part of a broader growth shift that led to a 600% revenue increase in ten months.
3. Which Teams Use CRM Reporting Across the Business
Sales leaders use CRM reporting to inspect pipeline quality, rep activity, and forecast confidence. Marketing teams rely on it to connect lead sources, campaign influence, and handoff quality. Service managers watch case trends, resolution themes, and retention signals. Executives, finance, and operations teams then use the same reporting layer to align staffing, budgets, priorities, and expectations across the business.
CRM Reports vs CRM Dashboards
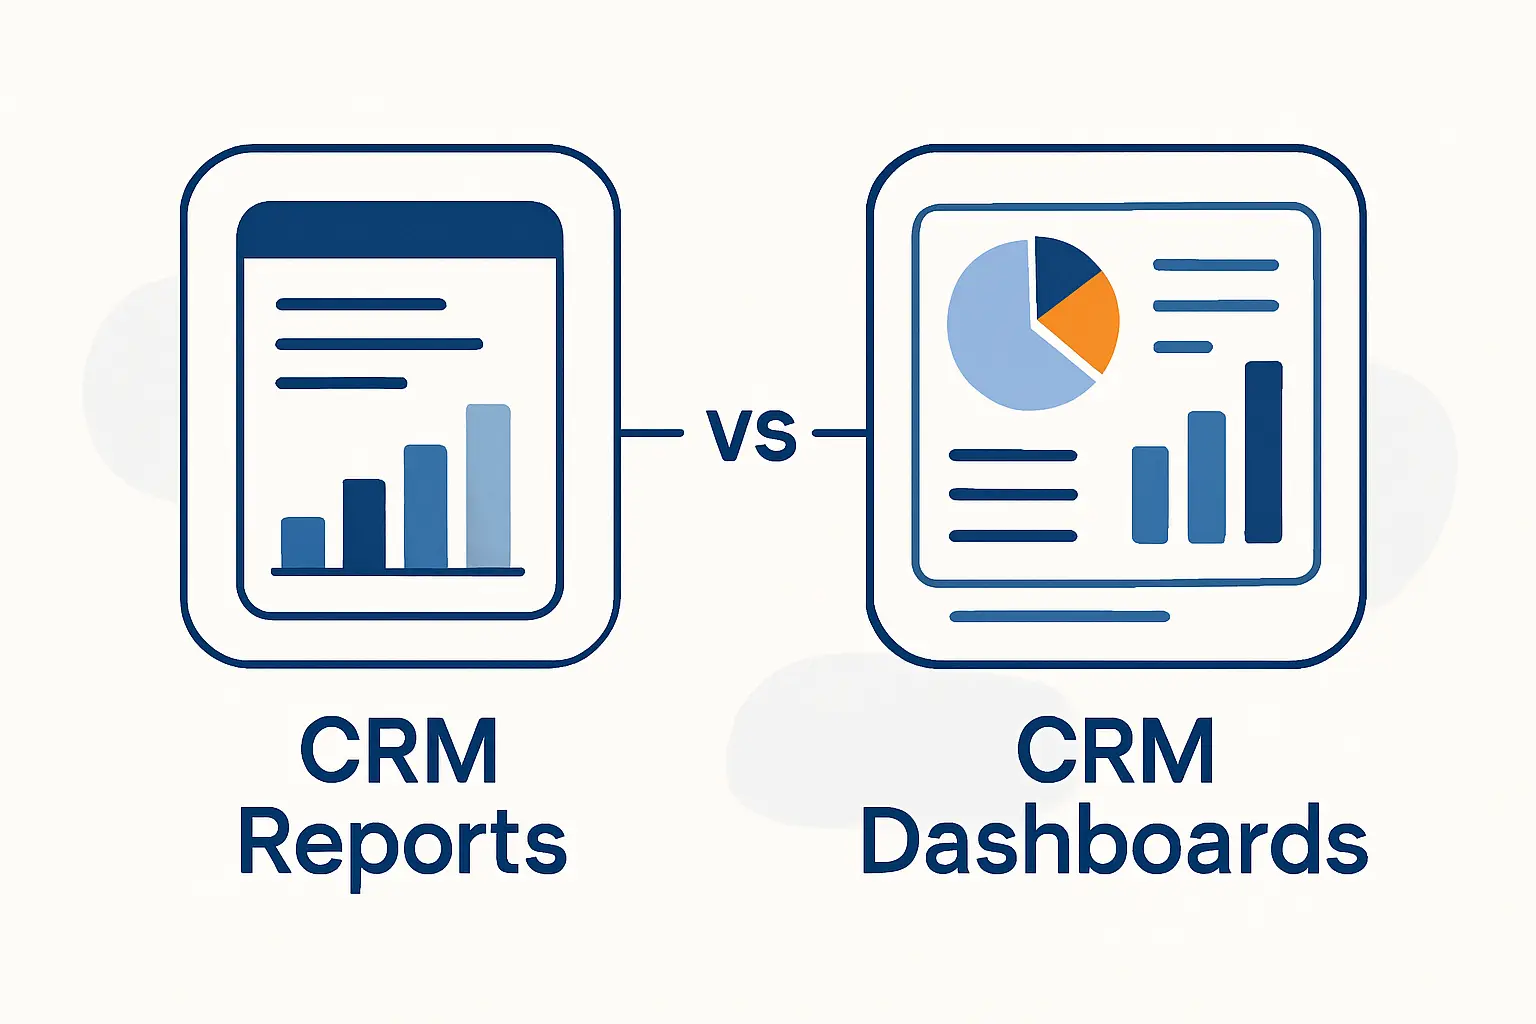
These terms get mixed up all the time, yet they serve different jobs. We like a simple rule at 1Byte: dashboards show motion, while reports explain cause.
1. When to Use Reports for Deeper Analysis
Reports are best when a team needs detail, filtering, history, and comparison. Because they can group data, apply formulas, and let users drill into the records behind the numbers, they are ideal for root-cause analysis. If conversion drops, a report can separate the problem by segment, source, stage owner, region, or product line. That depth is what turns a vague concern into a fixable issue.
2. When Dashboards Work Best for Real-Time Visibility
Dashboards work best when people need a fast read on what is changing right now. A sales manager can scan pipeline movement, a support lead can watch backlog pressure, and a marketing director can see whether a campaign is pacing well without opening multiple tabs or exporting tables. By keeping the most important metrics visible, dashboards reduce reaction time and help teams spot trouble before it spreads.
3. How Reports and Dashboards Work Together
Reports and dashboards should feed each other rather than compete. When a dashboard tile turns red, the linked report should show the records, filters, and trends behind that signal so someone can investigate immediately. HubSpot’s Databox case study on Revenue River is a practical illustration: once the team consolidated shared, real-time views, it cut time spent on reporting by 50% and gained more room for interpretation instead of manual assembly.
Why CRM Reporting Matters for Business Growth
Once the mechanics are clear, the bigger question is why leadership should care. Good CRM reporting matters because it improves how a company allocates attention, money, and effort when the stakes are high and the pipeline is moving fast.
1. Better Visibility and Data-Driven Decision-Making
Better visibility sounds modest, but it changes behavior. Teams that see the same data argue less about whose spreadsheet is right and spend more time deciding what to do next. That is especially important in commercial systems, where Gartner says CRM sales software grew at 12.2% to $25.7 billion in 2024, suggesting buyers continue to pay for tools that improve seller efficiency, pipeline control, and revenue clarity.
2. More Accurate Forecasting, Pipeline Health, and Resource Planning
Forecasting is where weak CRM reporting gets expensive. If stages are inconsistent, close dates float, or reps update opportunities late, resource planning becomes theater rather than management. Deloitte notes that best-in-class organizations can reach >80% forecasting accuracy, 30 days out, and we read that as a reminder that disciplined reporting is not back-office housekeeping; it is a revenue safeguard.
3. Stronger Customer Retention, Marketing ROI, and Team Alignment
Retention and marketing performance both improve when teams can see the same customer story. A campaign report that stops at lead volume misses whether those contacts become healthy accounts, and a service report that ignores revenue hides which customers deserve urgent attention. When CRM reporting connects acquisition, service, and renewal data, teams stop optimizing for local wins and start protecting lifetime value.
How CRM Reporting Works
Behind every useful report is a chain of work that most people never see. From our perspective, the quality of that chain matters as much as the chart at the end, because a clean visual built on sloppy logic still leads to bad decisions.
1. Data Collection From Sales, Marketing, Service, and Customer Touchpoints
Data collection starts with touchpoints: form fills, email engagement, meetings, calls, opportunities, orders, support conversations, renewals, and customer feedback. In mature setups, those signals also come from connected tools such as marketing automation platforms, help desks, billing systems, and product usage trackers. The goal is not to capture everything indiscriminately; it is to capture the fields that explain customer movement and operational health.
2. Data Analysis, Visualization, and Report Generation
Analysis begins after the data is cleaned, mapped, and standardized. At that stage, teams apply filters, calculated fields, attribution rules, stage aging logic, and historical snapshots so the report reflects reality rather than a momentary screen view. Visualizations then help people compare movement over time, identify outliers, and separate signal from noise without reading rows one by one.
3. Distribution, Interpretation, and Action
A report has value only when someone receives it, understands it, and owns the next action. Scheduled delivery, shared definitions, commentary, and follow-up workflows are what turn reporting from passive observation into an operating habit. In healthy organizations, each core report is tied to a review rhythm and a decision owner, so the data does not just sit there looking important.
Essential CRM Reporting Examples Every Team Should Track
Not every company needs a giant reporting library at the start. We usually recommend beginning with the reports that expose revenue flow, lead quality, customer health, and operational bottlenecks, then expanding once adoption is strong.
1. Pipeline Health and Stage Distribution Reports
Pipeline health and stage distribution reports show where opportunities sit, how evenly value is spread, and where deals are bunching up. When too much pipeline gets stuck in one stage, that often points to qualification issues, slow follow-up, pricing friction, or missing enablement. A good version of this report also highlights stale deals and stage aging so optimism does not mask inactivity.
2. Sales Forecast and Goal Progress Reports
Sales forecast and goal progress reports compare current opportunity data with expected outcomes and team targets. Used well, they help leaders separate committed revenue from hopeful revenue, coach earlier, and decide whether hiring, promotions, or budget changes are realistic. We are especially fond of forecasts that combine current pipeline shape with historical close behavior instead of trusting stage labels alone.
3. Lead Source, Lead Status, and Conversion Reports
Lead source, lead status, and conversion reports answer a simple but crucial question: where do good opportunities actually come from. Source data shows channel quality, status tracking reveals handoff discipline, and conversion views expose whether leads are being nurtured, ignored, or disqualified for the wrong reasons. Without this report, marketing and sales can spend months debating quality with no shared evidence.
4. Sales Activity, Call Outcome, and Rep Performance Reports
Sales activity, call outcome, and rep performance reports help managers distinguish productive effort from busywork. A high volume of calls or emails can look impressive until outcome tracking shows that certain activity types rarely create meetings, movement, or wins. Once those patterns are visible, coaching becomes more specific, and performance reviews become much fairer.
5. Win-Loss, Deal Source, and Stage Duration Reports
Win-loss, deal source, and stage duration reports reveal why revenue moves forward or dies on the vine. Win-loss data surfaces objections, competitors, pricing pressure, and fit issues, while stage duration shows where the sales process slows down. Deal source adds another layer by revealing whether some channels bring faster, cleaner wins than others.
6. Customer Interaction, Retention, and Service Reports
Customer interaction, retention, and service reports are essential if the business depends on renewals, upsell, or reputation. These reports connect case volume, response quality, escalation themes, satisfaction signals, and account history so teams can see whether service load is pointing toward churn or expansion. In our view, many businesses underinvest here and pay for it later in avoidable attrition.
7. Marketing Campaign, Revenue Attribution, and ROI Reports
Marketing campaign, revenue attribution, and ROI reports connect spend to outcomes that finance and leadership actually care about. Strong reports show influence across the funnel, not just top-of-funnel clicks or form completions, and they make attribution rules transparent so teams know how credit is assigned. That transparency matters because bad attribution quietly rewards the wrong campaigns.
8. Profitability, Product Performance, and Benchmark Reports
Profitability, product performance, and benchmark reports help companies decide which revenue is truly healthy. A customer segment can close quickly yet still be expensive to support, and a popular product can erode margin if it generates heavy service demand or discount pressure. For that reason, the best profitability views join CRM data with finance or ERP data instead of treating bookings as the whole story. Benchmark comparisons, whether internal or market-based, then help leaders judge performance against something real rather than habit.
CRM Reporting Metrics That Matter Most
A report is only as useful as the metrics inside it. We advise teams to choose measures that connect directly to decisions, because a crowded scorecard can hide the very signal it was meant to surface.
1. Pipeline Value, Deal Size, Win Probability, and Coverage Ratio
Pipeline value tells you how much potential revenue is in motion, while average deal size helps explain whether growth is coming from volume or larger opportunities. Win probability estimates how likely deals are to close based on current evidence, and coverage ratio tests whether the pipeline is deep enough to support the target ahead. Together, those metrics show not just how much pipeline exists, but how trustworthy it really is.
2. Conversion Rates, Sales Cycle Length, Activity Levels, and Quota Attainment
Conversion rates reveal where prospects stop progressing. Sales cycle length shows how fast value moves from lead to revenue, activity levels explain effort, and quota attainment keeps performance grounded in actual expectations. Taken together, these metrics help leaders separate a pipeline problem from a productivity problem and a productivity problem from a coaching problem.
3. Customer Satisfaction, Churn, Lifetime Value, and Campaign ROI
Customer satisfaction indicates how clients feel in the moment, but churn shows whether that feeling turns into lost revenue. Lifetime value adds a longer business lens, and campaign ROI clarifies whether acquisition spend is creating durable returns or short-lived spikes. When these measures sit in the same reporting environment, growth stops being a tug-of-war between sales, marketing, and service.
How to Set Up CRM Reporting the Right Way
Good CRM reporting does not happen because someone clicked the report builder and hoped for the best. Lasting setups begin with clear business intent, disciplined data habits, and a shared understanding of how metrics will be used.
1. Define Business Goals, Audiences, and KPIs
Start with business goals, not visuals. A leadership team may need forecast confidence, a sales manager may need pipeline inspection, and marketing may need source quality analysis; those are different audiences with different questions. Once the decisions are clear, the right KPIs become much easier to choose.
2. Clean and Standardize Your CRM Data
Clean and standardized data is the foundation every other reporting task sits on. Required fields, consistent stage names, ownership rules, deduplication, and controlled picklists matter because a report can only formalize the truth it receives. If the underlying data is crooked, the finished dashboard simply makes the mistake look official.
3. Choose the Right Reports, Templates, and Visualizations
Choose report types and visualizations based on the job to be done. Tables work well for detail and audits, trend lines help with movement over time, and funnel or stage views make leakage visible at a glance. We generally prefer simple visuals with strong filters over decorative charts that impress executives but answer nothing.
4. Automate Delivery, Train Users, and Review Results Regularly
Automation is the part many teams skip too soon. Scheduled delivery, threshold alerts, user training, and regular review meetings create a rhythm that keeps reports alive and trusted. Once people know when a report arrives, what it means, and what action follows, adoption becomes much more durable.
Key Features to Look For in CRM Reporting Tools
Software matters, but only when its features support the reporting model you actually need. At 1Byte, we look for tools that reduce friction for everyday users while still giving analysts enough control to build reliable logic.
1. Prebuilt Templates, Custom Reports, and Drill-Down Filters
Prebuilt templates help teams move quickly, especially for common use cases like pipeline, forecast, lead conversion, and service performance. Custom reporting matters just as much, though, because every business eventually needs filters, calculated fields, and grouped views that reflect its own process. Drill-down capability is the hinge between the two, letting people move from summary to record-level evidence without leaving the workflow.
2. Real-Time Dashboards and Visual Analysis
Real-time dashboards and visual analysis are valuable when teams need to react while work is still underway. The best tools let users compare live performance, spot unusual movement, and change filters without rebuilding the report each time. Visuals are not decoration in this context; they are the fastest way to make operational patterns understandable.
3. Integrations, Cross-Department Reporting, and Sharing
Integrations are essential because revenue rarely lives in a single application. Marketing data, support activity, billing history, and product signals often sit in different systems, so cross-department reporting depends on syncing them cleanly and defining a shared source of truth. In a cloud stack, sync delays and mismatched field names can distort reporting quietly, so field mapping and refresh logic deserve real attention. Sharing features matter too, since a brilliant report is useless if the right people cannot access it in the right moment.
4. Ease of Use, Automation, and Role-Based Access
Ease of use affects adoption more than most teams expect. If building or reading a report feels slow, confusing, or restricted to specialists, frontline managers will revert to spreadsheets and side conversations. Role-based access, scheduled automation, and a clean interface keep reporting secure without turning it into a bottleneck.
Common CRM Reporting Challenges and How to Fix Them
Even mature teams stumble over the same traps. The good news is that most CRM reporting problems are less about the report itself and more about governance, clarity, and consistency behind the scenes.
1. Poor Data Quality and Incomplete Records
Poor data quality usually shows up as missing fields, duplicate accounts, outdated opportunity stages, and uneven activity logging. The fix is rarely heroic; it is operational. Better field rules, ownership standards, validation, cleanup routines, and rep training do more for reporting accuracy than any fancy visualization layer ever will.
2. Too Many Metrics and Unclear Priorities
Too many metrics create a quiet kind of chaos. When every team tracks its own favorite indicators without a clear hierarchy, meetings fill with numbers but starve for decisions. We recommend a small set of core KPIs for company-wide alignment, then a limited set of supporting measures for each function.
3. Data Silos, Limited Flexibility, and Inconsistent Reporting
Data silos, limited flexibility, and inconsistent reporting usually appear when departments define the same terms differently or export separate versions of the truth. A shared metric dictionary, integrated systems, and reusable templates fix much of this problem. From there, teams can adapt reports for their own needs without breaking the underlying logic.
How AI Is Making CRM Reporting Smarter
AI is changing CRM reporting, but not by replacing judgment. In our view, its real value lies in shortening the distance between raw data, pattern detection, and timely action.
1. Predictive Forecasting and Opportunity Scoring
Predictive forecasting and opportunity scoring help revenue teams prioritize what deserves attention before the quarter slips away. McKinsey estimates generative AI could increase sales productivity by approximately 3 to 5 percent of current global sales expenditures, and much of that upside depends on cleaner signals, better prioritization, and faster interpretation inside reporting workflows.
2. Natural Language Queries and Automated Insights
Natural language queries make reporting more accessible to non-analysts. Instead of navigating complex builders, a manager can ask for closed-won deals by source, open cases by priority, or accounts with falling engagement and get an immediate result. That lowers the barrier to insight and helps teams ask follow-up questions while context is still fresh.
3. Data Cleanup, Pattern Recognition, and Proactive Alerts
AI also helps with data cleanup, anomaly detection, and proactive alerting. It can flag missing fields, identify suspicious stage changes, surface unusual churn patterns, and suggest next actions when trends deviate from expectation. Used carefully, with human review and clear rules, those capabilities make CRM reporting feel less like a rearview mirror and more like an early warning system.
FAQ About CRM Reporting
Before we wrap up, let us answer the questions we hear most often from teams that are trying to make CRM reporting practical, not theoretical.
1. What Is CRM Reporting?
We define CRM reporting as the process of turning CRM data into structured reports that help people understand sales performance, marketing effectiveness, service quality, and customer behavior. The point is not to generate paperwork; it is to support decisions with evidence.
2. What Does CRM Stand For?
CRM stands for customer relationship management. The term can describe both the strategy for managing customer interactions and the software platform used to store, track, and analyze that information.
3. What Is the Difference Between CRM Reports and CRM Dashboards?
A report gives detailed analysis that can be filtered, grouped, and audited. A dashboard gives a quick visual summary of key metrics. Put simply, reports answer deeper questions, while dashboards make important changes easy to spot.
4. What Are the Most Important CRM Reports to Track?
The most important CRM reports usually include pipeline health, forecast progress, lead source and conversion, rep activity and outcomes, win-loss analysis, customer retention, service performance, and marketing ROI. The exact mix depends on your sales model, support burden, and reporting maturity.
5. How Do You Generate a CRM Report?
To generate a CRM report, start with a business question, identify the right fields and filters, clean the underlying data, choose the appropriate report type, and then test the result against known records. Once the logic is trusted, automate delivery and assign an owner for follow-up.
6. How Does AI Improve CRM Reporting?
AI improves CRM reporting by identifying patterns faster, predicting likely outcomes, helping users query data in plain language, and flagging missing or suspicious records before they distort analysis. In short, it can make reporting both smarter and faster when the underlying data model is sound.
CRM Reporting Takeaways
1. Start With Clean Data, Core Reports, and Clear Business Goals
Clean data, a focused report set, and clear business goals are still the foundation. Before adding complex AI features or extra visual layers, we suggest making sure your pipeline stages, ownership rules, source fields, and review habits are trustworthy enough to support basic decisions.
2. Turn CRM Reporting Into a Long-Term Competitive Advantage
Long term, CRM reporting becomes a competitive advantage when it shapes daily behavior rather than living as an executive artifact. If your team can see the truth early, respond consistently, and learn from each cycle, the business moves with less drama and more control. Our advice at 1Byte is to pick the report that most affects revenue or retention, clean the data behind it, and tie it to a real decision. Which decision should your next CRM report improve?