

- Traceroute Is a Network Tool That Maps an IP Packet Path
- How the Tool Reveals Each Hop Between Source and Destination
- Ways to Run Traceroute on Different Platforms
- How to Read the Output Without Guessing
- What Traceroute Helps You Troubleshoot
- Common Names, Versions, and Alternatives
- Where the Results Can Mislead You
- FAQ
- How 1Byte Supports Customers Working With Traceroute
- Conclusion
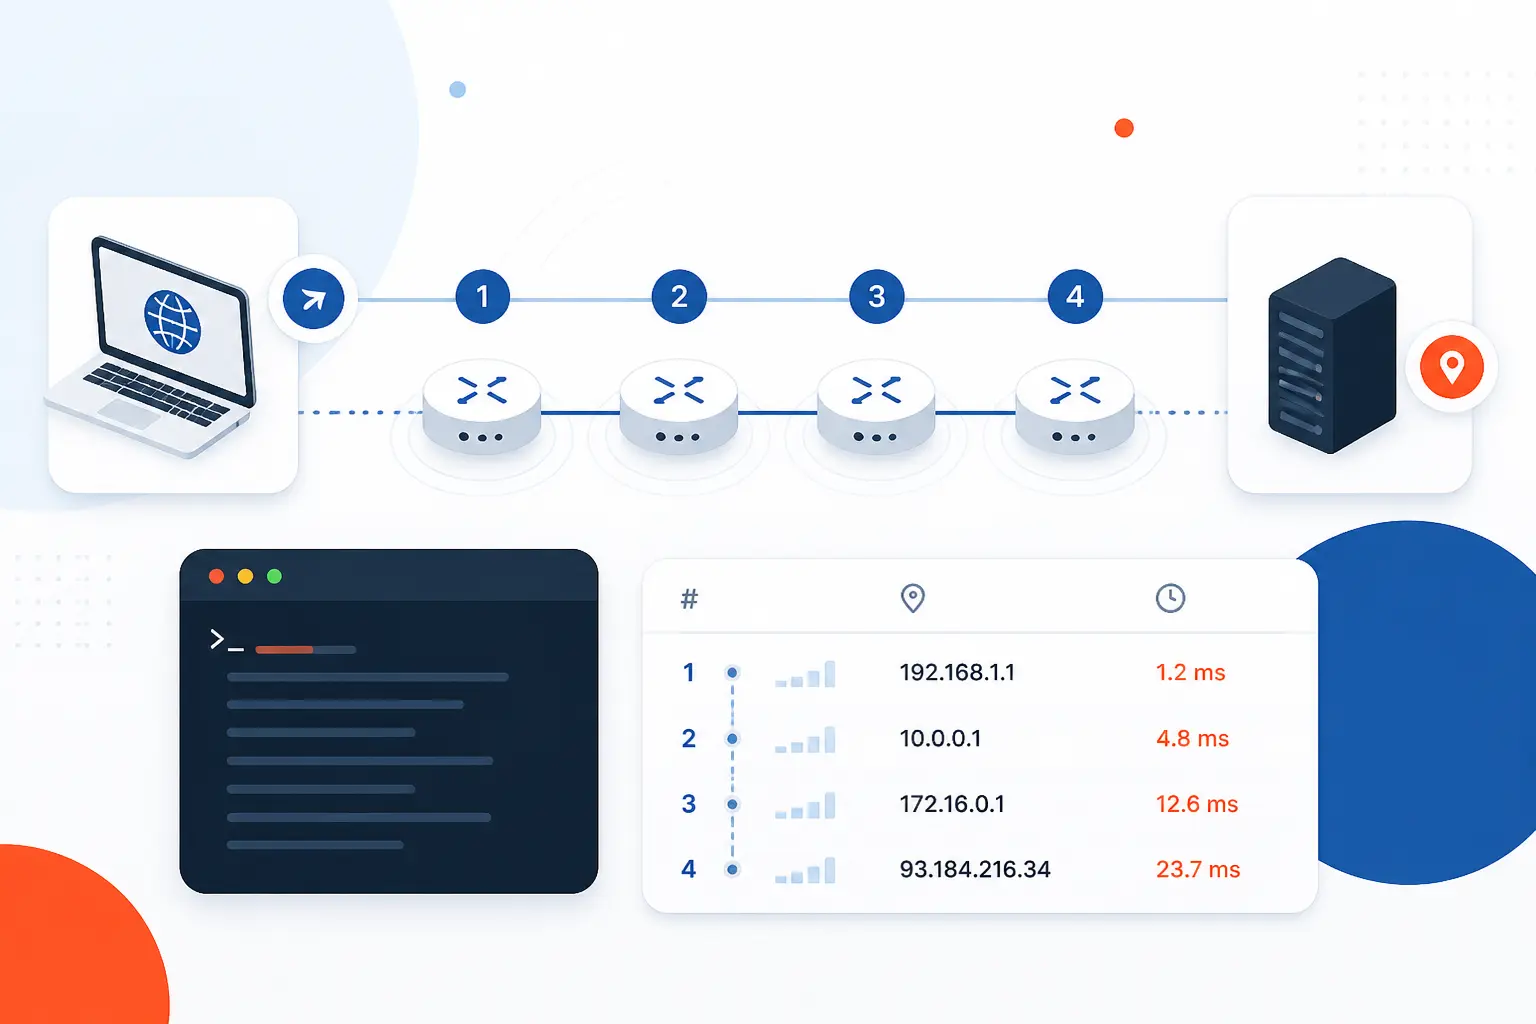
Traceroute is a network tool that shows the path an IP packet appears to take from your device to a destination, such as a website, server, or IP address. It lists the routers, or “hops,” that answer along the way and shows the time each reply takes. We use traceroute when we want to separate a local problem from an internet routing problem, a hosting-side problem, or a destination-side problem. It does not show every hidden device on the internet, and it does not prove that an application will work, but it gives a quick map of where packets are slowing down or disappearing.
At 1Byte, we like traceroute because it turns an invisible trip into readable clues. A browser may only say “site can’t be reached,” which tells us almost nothing. A trace can show whether the packet dies at the home router, the internet provider, a backbone network, a CDN edge, or near the destination server. That is why it remains one of the first tools we reach for when diagnosing reachability and latency complaints.
Traceroute Is a Network Tool That Maps an IP Packet Path
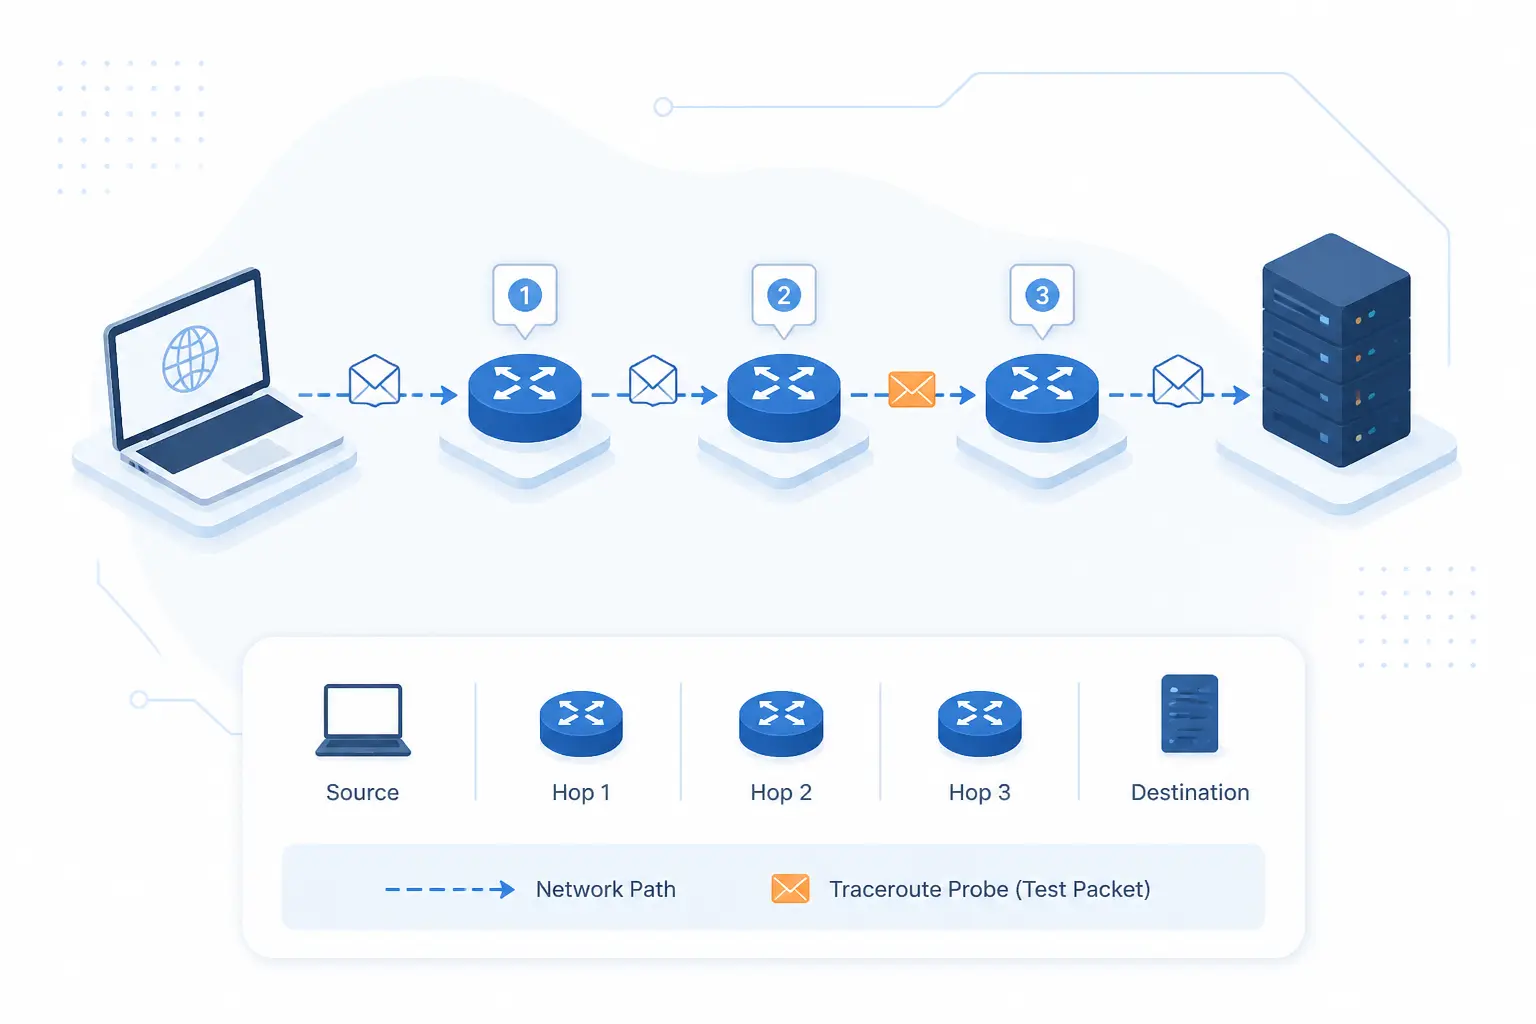
Traceroute is best understood as a packet-path map, not a full network scanner. It sends test packets toward a destination and records the routers that send back control messages. Each router that responds becomes one line of output. The result is a hop-by-hop view of the forward path from the source to the destination, with timing data attached.
The word “path” needs a little caution. Internet routing is dynamic, so a trace is a snapshot from one source, at one moment, using one type of probe. If we run it from a laptop in Phnom Penh and then from a cloud server in Singapore, we may see different paths to the same domain. That difference is not a bug. It is how global routing, peering, CDN selection, and provider policy work.
A simple trace might begin at your Wi-Fi router, pass through your internet service provider, cross a regional network, reach a transit provider, and finally arrive at a hosting or CDN network. When a website feels slow, that list can be more useful than a vague “the internet is down” complaint. We can point to a specific stretch of the journey and ask sharper questions.
FURTHER READING: |
| 1. What Is ARPANET? Origins, Operation, and Legacy |
| 2. What Is a VPN Tunnel? How It Works, Types, and Uses |
| 3. What Are Subnet Masks and How Do They Shape IPv4? |
How the Tool Reveals Each Hop Between Source and Destination
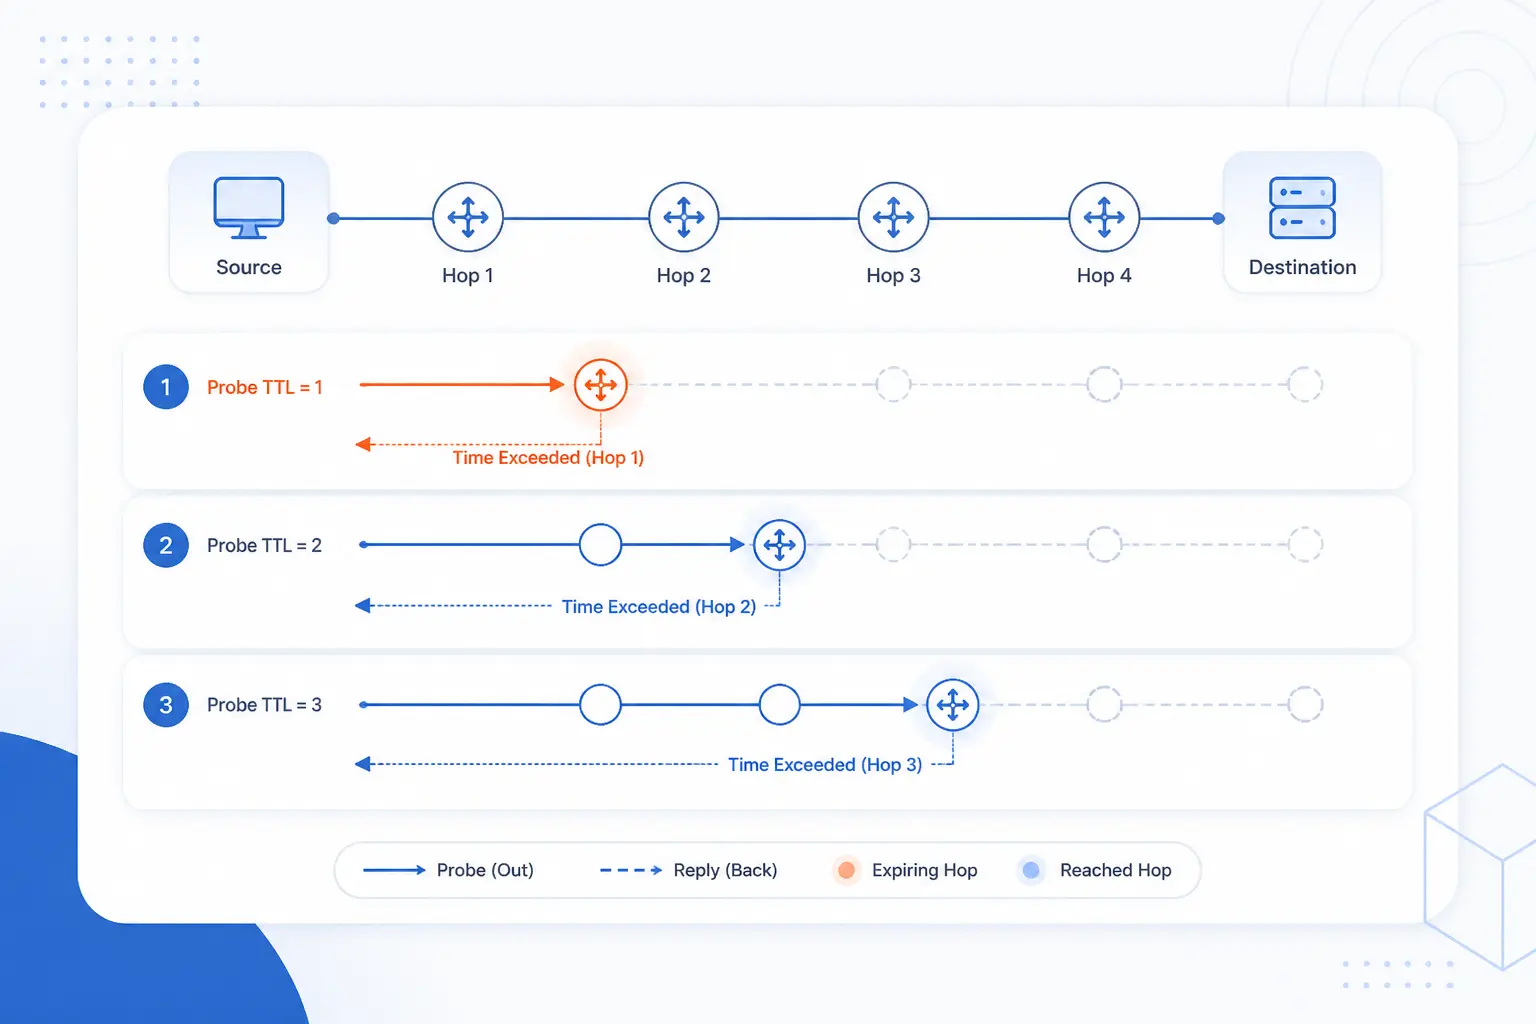
Traceroute reveals each hop by sending probes that are designed to expire gradually along the route. The first probe expires at the first router, the next one reaches a little farther, and the process repeats until the destination answers or the hop limit is reached. Each responding router sends back a control message, which lets the source print the router’s address and response time. This trick is simple, old, and still clever.
TTL Values and Why Probes Expire One Router at a Time
The core trick is that traceroute sends probes with deliberately small TTL values. TTL means Time To Live in IPv4, although in practice it behaves like a hop counter. A router forwarding an IPv4 packet must reduce the TTL by at least one, so a packet with TTL set low will expire after only a short trip.
Here is the practical flow. Traceroute sends a probe with TTL set to the first hop. The first router decrements it, sees that it has expired, drops the packet, and sends a message back. Then traceroute sends another probe with a higher TTL, which reaches the next router before expiring. Step by step, the path is revealed.
This is why traceroute output starts near you and moves outward. The first line is usually your local gateway or an upstream router. Later lines are farther away. If the final line is the target server or target edge, the trace reached the destination.
ICMP Replies That Expose Routers Along the Route
Routers appear in traceroute output because expired probes trigger ICMP error messages. For IPv4, the classic signal is an ICMP Time Exceeded message, defined as Type 11, Code 0. That reply includes enough information for the source device to match the response to the original probe.
Different systems use different probe styles. Windows tracert commonly uses ICMP Echo Requests. Many Unix-like traceroute implementations use UDP probes by default, though they often support ICMP or TCP modes too. The destination may answer differently than intermediate routers, but the idea stays the same: make each hop identify itself by forcing a controlled failure.
We should stress the word “controlled.” Traceroute is not breaking anything. It is asking the network a series of small questions and listening for standard control-plane answers.
Why Response Times Appear for Every Hop
The response time beside each hop is the round-trip time for that probe and reply. It measures how long the packet took to reach the responding router and how long the reply took to return. It is not a pure one-way delay measurement. That matters because the return path may differ from the forward path.
Most output shows several timings per hop because the tool sends more than one probe at each step. If the numbers are close together, the path is behaving consistently. If one number spikes but the others remain normal, we treat it as a clue, not a verdict.
Latency at a middle hop can also be misleading. Routers may give low priority to answering diagnostic probes while still forwarding user traffic normally. We worry more when high latency begins at one hop and continues through every later hop.
Ways to Run Traceroute on Different Platforms
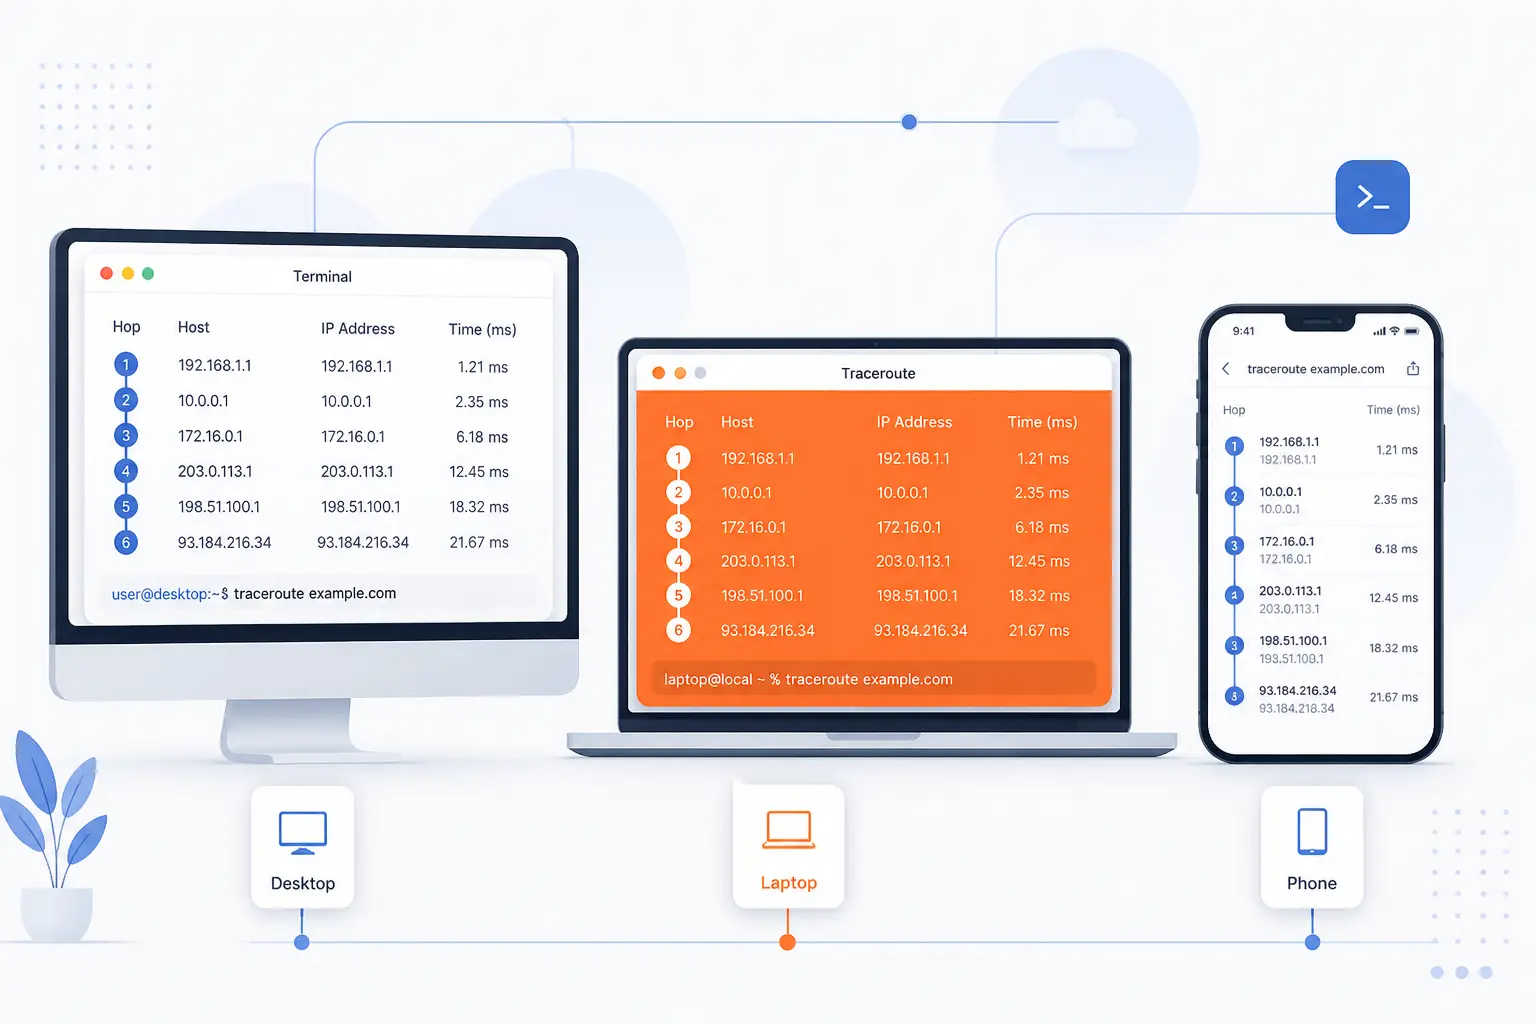
You can run traceroute from almost any operating system, but the command name and probe behavior vary. Windows uses tracert, while macOS and Linux usually use traceroute. Online and mobile tools are useful when you need a trace from another location. We prefer running it from the affected device first, then comparing it with a second viewpoint.
| Platform | Common command or tool | Best use |
|---|---|---|
| Windows | tracert | Quick checks from a user workstation |
| macOS and Linux | traceroute | Flexible testing with UDP, ICMP, or TCP options |
| Online and mobile | Web tools or network apps | Comparing paths from other networks |
Windows With the Tracert Command
On Windows, the built-in command is tracert. Open Command Prompt or PowerShell, then run a command such as tracert example.com. Windows documentation describes tracert as using a maximum of 30 hops by default, which is enough for most public internet paths.
Useful Windows options include tracert -d example.com, which skips DNS name lookups and can make results appear faster. You can also force address families with -4 or -6. We often ask customers for both the normal version and the -d version because DNS lookups can clutter the output.
A practical Windows workflow is simple: run the trace, copy the full output, and include the time and network you tested from. “Office Wi-Fi at 9:20 a.m.” is much more useful than a screenshot with no context.
Mac and Linux With the Traceroute Command
On macOS and Linux, the usual command is traceroute example.com. Linux implementations commonly support several probe methods, including ICMP and TCP, while the traditional method sends UDP datagrams beginning at port 33434. That flexibility helps when firewalls treat one probe type differently from another.
If the basic command gives mostly asterisks, try another method. On many Linux systems, traceroute -I example.com uses ICMP Echo probes, and traceroute -T example.com uses TCP SYN probes. Some systems require elevated privileges for certain probe types.
On macOS, Network Utility used to give a graphical route tool, but Terminal is the reliable path now. We recommend saving the command output as text. It is easier to read, search, and compare than an image.
Online and Mobile Tracing Tools
Online and mobile tools are best for getting a second viewpoint from another network. If your laptop trace fails but an online trace succeeds, the issue may sit between your access network and the destination. If both fail near the same destination network, the problem may be closer to the service.
Use these tools carefully. An online trace starts from the tool provider’s server, not from your device. That means it may take a completely different route. It is useful for comparison, but it cannot replace a trace from the network where the problem actually happens.
Mobile traces can also reveal whether a fault is tied to one ISP. If your home broadband struggles but mobile data reaches the site cleanly, we have a stronger reason to inspect local routing, DNS, or provider-side filtering.
How to Read the Output Without Guessing
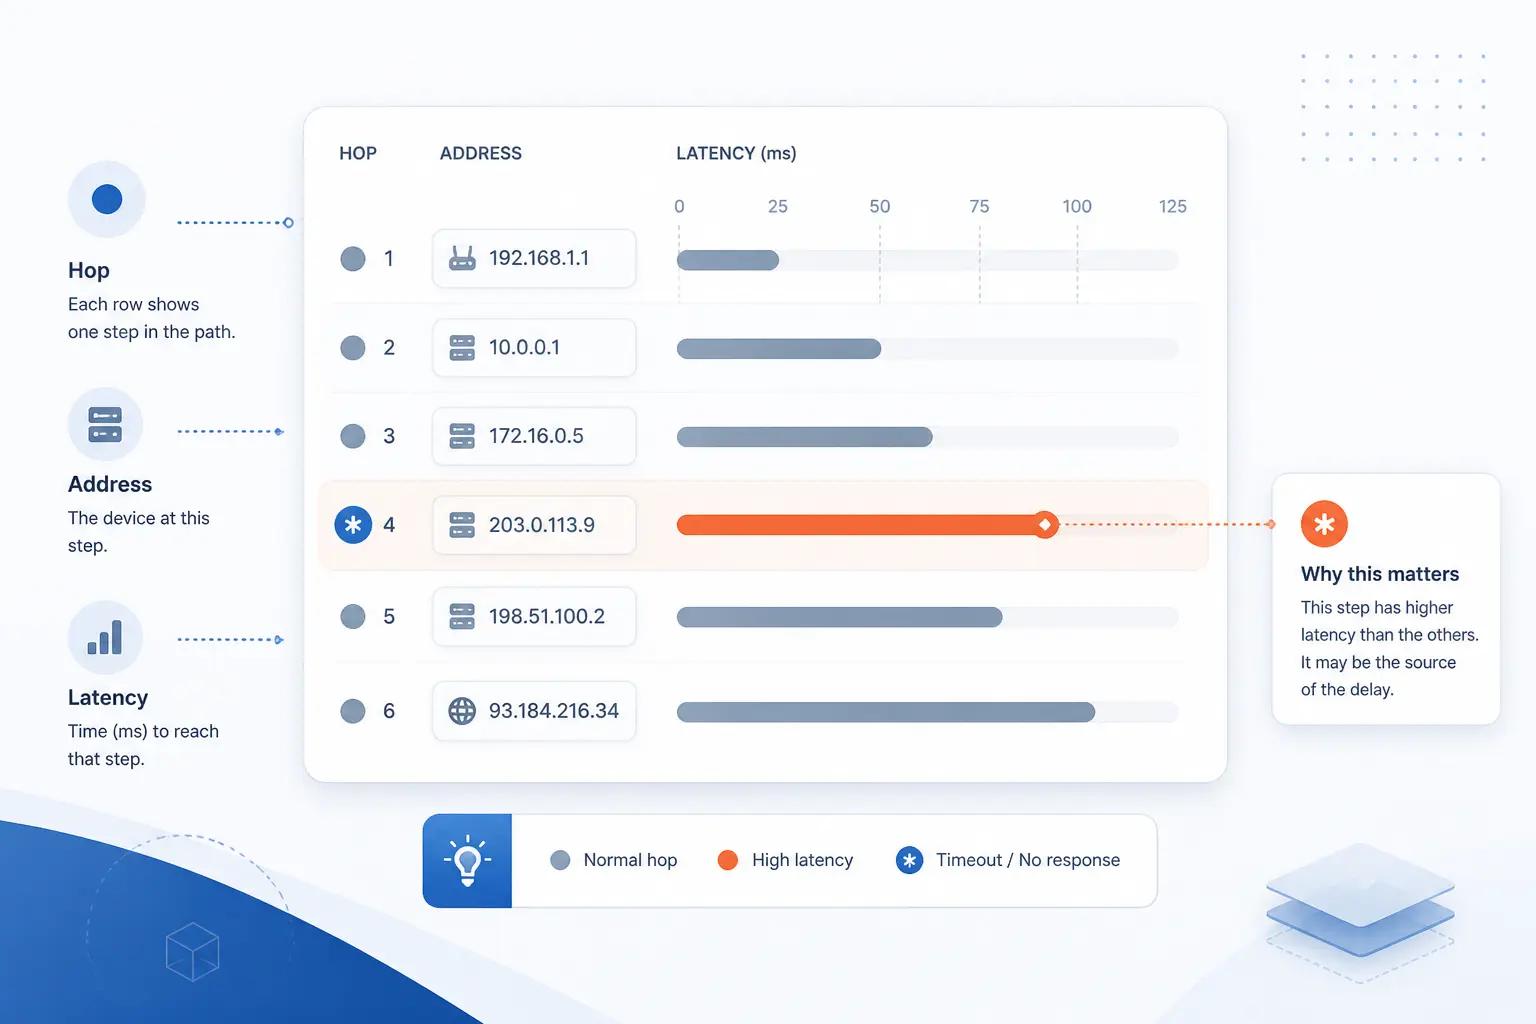
You read traceroute output by looking at hop order, addresses, names, timings, and missing replies together. No single line tells the whole story. A hop with an asterisk is not automatically broken. A hop with a scary latency number is not automatically guilty. The pattern across later hops is where the answer usually lives.
Hop Numbers, Hostnames, and IP Addresses
Hop numbers show the order in which routers responded from your source to the destination. Hop one is closest to you. Later hops are farther away. If a hop has a hostname, it came from reverse DNS, which may hint at the provider, city code, or network role.
IP addresses are more dependable than names, but names are often helpful. For example, a name containing an airport-style city code may suggest geography. A name containing “edge” or “cache” may suggest a CDN device. Still, reverse DNS can be outdated, missing, or creatively named.
We read hostnames as clues, not sworn testimony. If the name says one city but latency suggests another, we do not rush to judgment. We compare with other evidence, such as multiple traces, provider status pages, and application logs.
Latency Measurements and What Transit Delays Suggest
Latency measurements show how long each probe took to go out and come back. Low numbers near your router are normal. Higher numbers appear as packets travel farther, cross providers, or pass through congested segments. What matters most is where the increase begins and whether it continues.
If hop five jumps from local latency to much higher latency and every later hop stays high, that hop or the link after it deserves attention. If only hop five is high but hop six and later return to normal, that router may simply be slow to answer probes. Forwarding traffic and answering diagnostics are not the same job.
Distance also matters. A path crossing an ocean will take longer than a path staying in the same metro area. Physics has a vote here, and no hosting provider can negotiate with light in fiber.
Asterisks, Timeouts, and Non-Responding Routers
Asterisks mean traceroute did not receive a reply before the timeout. That can happen because a router blocks the response, rate-limits diagnostic traffic, drops the probe, or never receives it. It does not always mean traffic stopped there.
The next line is the key. If later hops continue to respond, the hop with asterisks is probably just silent. If the trace turns into a wall of asterisks after one point and never recovers, the last successful hop becomes more interesting.
This is one of the most common mistakes we see. Someone points to the first asterisk and says, “That router is down.” Often, the destination still loads fine, and the router simply does not answer diagnostic packets.
When One Hop Shows More Than One Address
One hop may show more than one address because different probes can take different equal-cost paths. Large networks often balance traffic across several routers or links. Traceroute sends multiple probes, and each one may receive a reply from a different interface.
This behavior is common in provider cores and cloud networks. It may look messy, but it is often normal. We pay attention when the variation matches packet loss, rising latency, or failed application traffic.
When in doubt, run the test more than once. If the same hop changes every time but the destination remains reachable, load balancing is a likely explanation. If the destination fails only through one branch, deeper testing is needed.
What Traceroute Helps You Troubleshoot
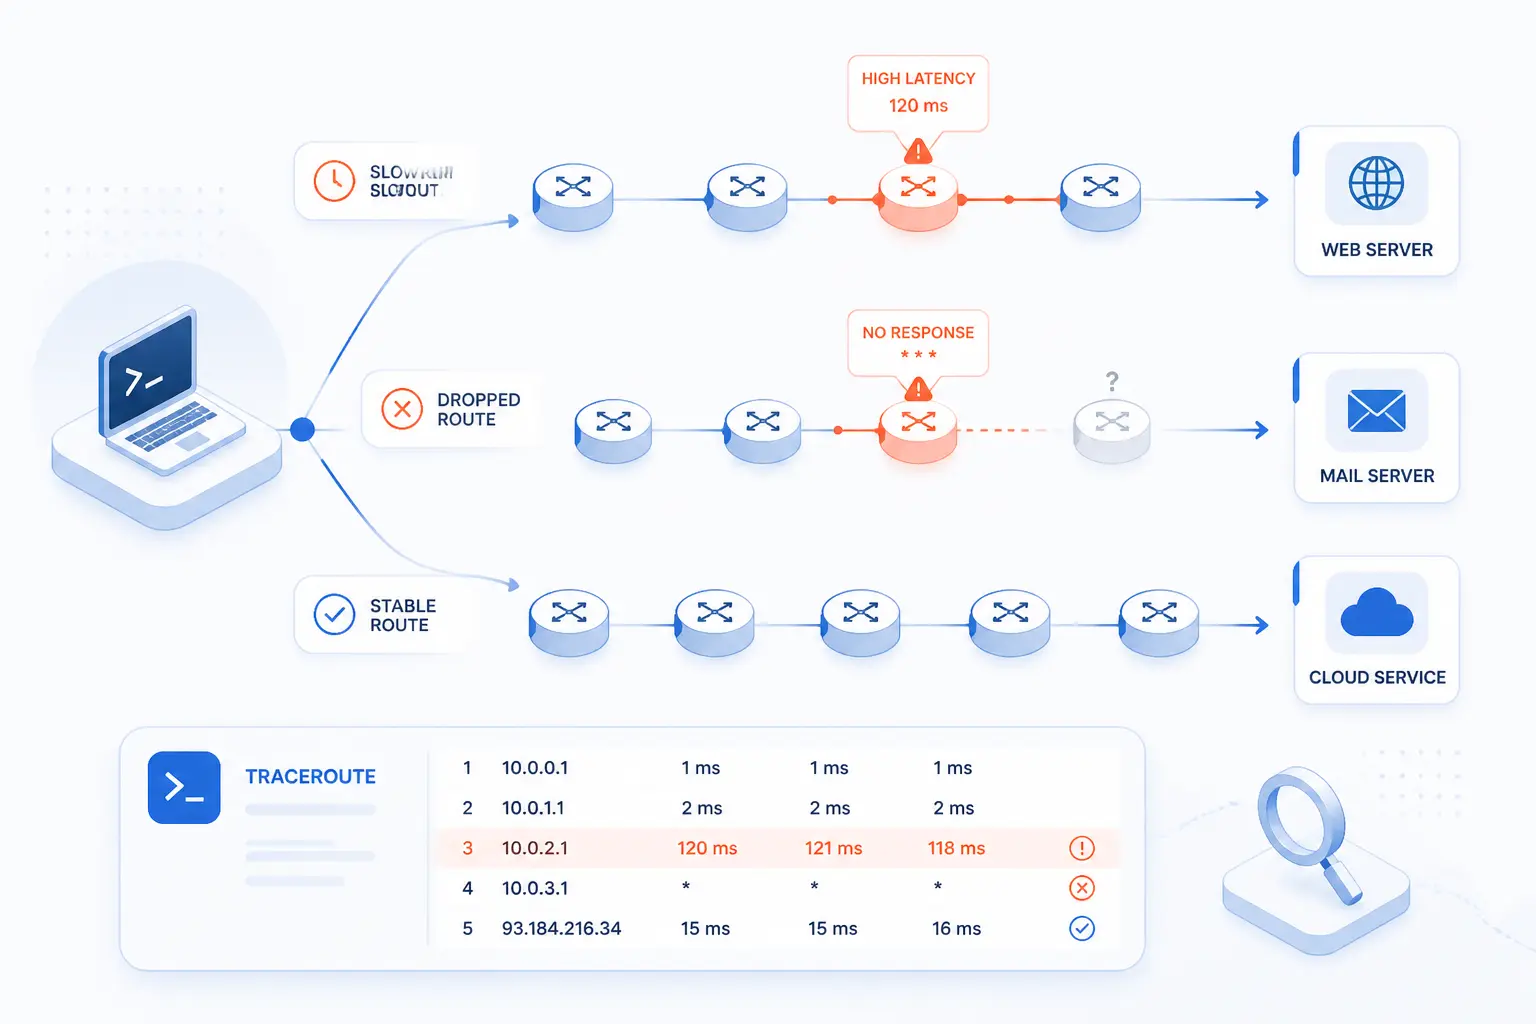
Traceroute helps troubleshoot slow connections, dropped paths, routing surprises, and CDN delivery behavior. It is especially useful when a problem affects some users but not others. A trace can show whether affected users share the same failing segment. It cannot fix the problem alone, but it tells us where to look next.
Slow Connections and Sudden Latency Jumps
Traceroute helps spot where latency begins to rise along a path. If the delay starts inside the local network, we check Wi-Fi, routers, and access links first. If it starts after the ISP handoff, the issue may involve transit, peering, or a distant destination.
A real-world example: a customer says their WordPress dashboard feels slow from one office. The website is fast from other countries. A trace from the office shows normal local hops, then a large jump at the provider’s international handoff. That does not prove guilt, but it gives the ISP a concrete starting point.
We also compare traces against application timing. If traceroute shows no unusual delay but the app is slow, the problem may be DNS, TLS negotiation, database work, server CPU, or code execution instead.
Connection Drops and the Last Successful Hop
When a trace fails completely, the last successful hop helps narrow the break point. If the last response is your home router, the issue is local or access-side. If several ISP hops respond and then everything stops, the problem may be farther upstream.
The “last successful hop” is not always the broken device. The failure may sit just after it, or replies from later devices may be filtered. Still, it gives support teams a useful boundary.
We like to pair this with ping and an application test. If ping to the destination fails, the trace stops early, and the website also fails, the evidence lines up. If the trace stops but the website works, filtering is more likely than outage.
Misrouting, Geographic Detours, and CDN Delivery Paths
Traceroute can reveal when traffic takes an unexpected geographic detour. A user in one country may expect a nearby edge, but the path may travel through another region because of peering policy, DNS location, or CDN selection. That detour can add delay even when every router is healthy.
CDNs make this especially interesting. A domain may resolve to an edge location selected for one user, while another user reaches a different edge. Both can be correct. The best question is whether the chosen path matches user experience.
For hosting teams, this is where traceroute earns its keep. We can compare paths from customers, monitoring nodes, and cloud servers. If only one region takes the long road, the next step is usually DNS, CDN, or network-provider investigation.
Common Names, Versions, and Alternatives

Traceroute has different names and relatives because operating systems evolved their network tools separately. Windows calls its built-in command tracert. Unix-like systems usually call it traceroute. Alternatives such as MTR, PathPing, and Tracepath add repeated testing, packet-loss views, or path MTU discovery.
| Tool | Typical platform | What makes it useful |
|---|---|---|
tracert | Windows | Built-in route checks from Command Prompt or PowerShell |
traceroute | macOS, Linux, Unix-like systems | Flexible probe methods on many systems |
MTR | Linux, macOS, Windows ports | Continuous path and latency observation |
PathPing | Windows | Route view plus packet-loss statistics |
Tracepath | Linux | Simple path checks with MTU discovery |
Traceroute vs Tracert
Traceroute and tracert serve the same basic purpose but differ by platform and probe behavior. The name tracert is the Windows command. The name traceroute is common on macOS, Linux, and other Unix-like systems.
The output style is similar enough that support teams can read both. Hop numbers, response times, IP addresses, and timeouts mean roughly the same thing. The subtle differences matter when filters block one probe type but allow another.
Our practical advice is simple: use the native command first. If results are confusing, test from another platform or use a different probe mode where available.
IPv6 With Traceroute6 and Tracert6
IPv6 tracing uses the same basic idea, but the field is called Hop Limit instead of TTL. The IPv6 specification says forwarding nodes decrement the Hop Limit, and packets are discarded when that limit is exhausted. So the concept is cleaner: one hop consumes one unit.
Some systems provide traceroute6 for IPv6. Others use traceroute -6. On Windows, tracert -6 example.com is the common form.
IPv6 results may differ from IPv4 results for the same domain. That is normal. The two address families can use different routes, different provider policies, and different CDN edges.
MTR, PathPing, and Tracepath
MTR is useful when one snapshot is not enough. It combines ping-like repeated measurement with hop discovery in a single network diagnostic tool. We use it when latency or packet loss appears intermittently and a one-time trace misses the bad moment.
PathPing is a Windows tool that reports latency and network loss at intermediate hops. It takes longer than a basic trace because it gathers statistics. That extra wait can be worthwhile when packet loss is the real complaint.
Tracepath is a Linux tool that can discover MTU information while checking reachability, and its manual describes it as not requiring superuser privileges. It has fewer options than full traceroute. For quick checks on Linux systems, that simplicity can be a plus.
Where the Results Can Mislead You
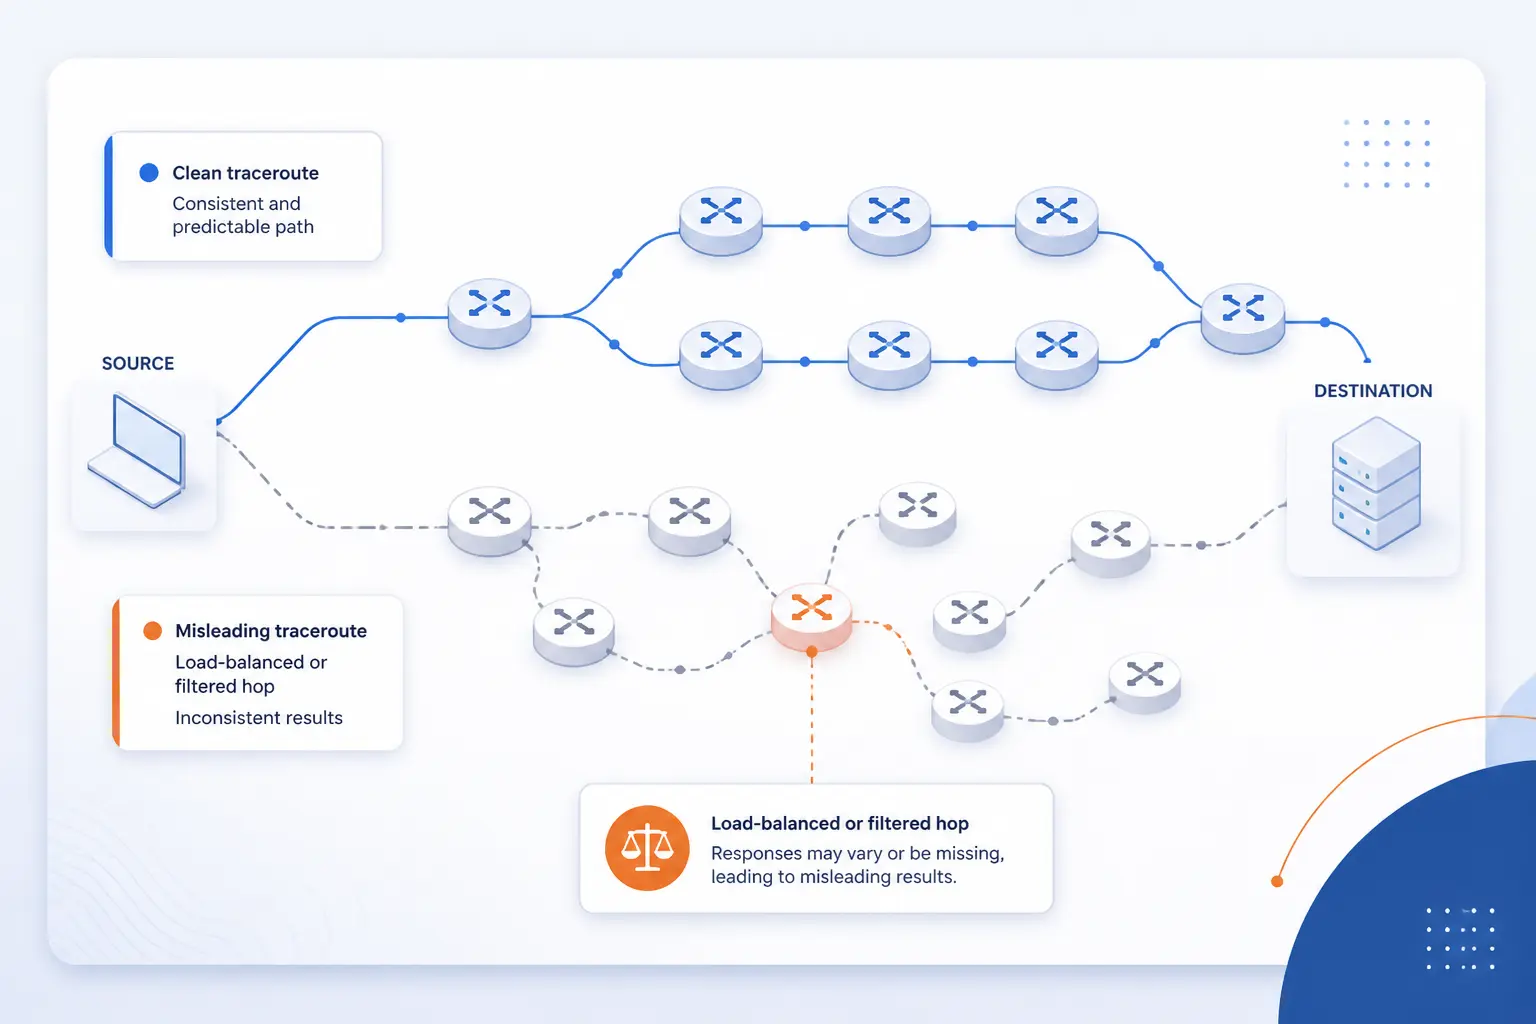
Traceroute can mislead you when routers filter replies, load balancing changes paths, or application traffic uses a different protocol path. It shows how probes behave, not a complete truth table for every service. A clean trace does not guarantee that HTTPS, SSH, email, or a database connection will work. A messy trace does not always mean users are affected.
Blocked ICMP Traffic and Firewall Filtering
Blocked ICMP traffic can make healthy routers look invisible. Many networks restrict diagnostic replies to reduce noise, limit abuse, or protect router control planes. When this happens, traceroute prints asterisks even though normal user traffic may continue.
Firewalls can also treat probe types differently. ICMP may be blocked while TCP to a web port is allowed. UDP probes may be filtered while HTTPS traffic passes without trouble.
That is why we do not diagnose from one trace alone. If a website works in the browser but the trace is full of timeouts, the network may simply be unfriendly to diagnostic packets. Switch probe types if your platform allows it.
Load Balancing and Paths That Change Between Probes
Load balancing can make one trace look like several paths stitched together. Modern networks often spread traffic across equal-cost links. Since traceroute sends multiple probes, those probes may not follow identical paths.
This is especially visible when a hop lists different IP addresses on the same line. It can also produce odd latency variation. One probe may cross a busier link, while the next takes a cleaner one.
For serious investigations, we repeat the test and compare patterns. If changes are random but the destination works, we keep calm. If one branch always fails, we dig into that branch.
Why a Successful Trace Does Not Prove Every App Will Connect
A successful traceroute proves only that the probes received enough replies to map a path. It does not prove that the destination application is listening, that TLS is valid, or that a firewall permits the real service. Ping documentation, for example, describes Echo Request and echo Reply messages, which are different from opening a web or database session.
Think of it like checking the road, not the shop. The road may be open, but the door may still be locked. A trace can succeed while port 443 is blocked, a certificate is expired, or a web server returns an error.
So our workflow is layered. We test DNS, trace the route, check the target port, review TLS, and inspect server logs. Traceroute is one piece of the puzzle, not the whole puzzle.
FAQ
This FAQ answers the quick questions beginners usually have about traceroute. The short version is that it maps packet hops, helps locate delay or failure points, and complements tools like ping. Use it when reachability feels unclear and you need more detail than “up” or “down.” Keep the output in context, because filters and load balancing can change what you see.
What Is Traceroute and Why Is It Used?
Traceroute is a diagnostic command that shows the routers a packet appears to pass on its way to a destination. It is used to find where latency, routing detours, or connection failures may begin. Network teams use it because it turns a vague connectivity complaint into a hop-by-hop clue trail.
How Do You Use Traceroute?
You use traceroute by opening a command line and running the route command for your operating system with a domain or IP address. On macOS or Linux, that may be traceroute example.com. On Windows, it is usually tracert example.com. Then read the hop list from top to bottom.
How Do I Run a Traceroute on Windows 11?
On Windows 11, open Command Prompt or PowerShell and run tracert example.com. Replace example.com with the domain or IP address you want to test. If the output is slow or cluttered, try tracert -d example.com to skip hostname lookups.
Is Traceroute Still Used?
Yes, traceroute is still used because it gives fast visibility into network paths. It remains useful for help desks, hosting teams, network engineers, and developers debugging regional access issues. We would not use it as the only test, but we would rarely ignore it.
What Is the Difference Between Ping and Traceroute?
Ping tests whether a destination responds and how long replies take, while traceroute shows the hops along the way. Ping is better for a quick reachability check. Traceroute is better when you need to know where the trip slows down or stops.
How 1Byte Supports Customers Working With Traceroute
At 1Byte, we use traceroute as a practical support conversation tool, not as a magic wand. It helps customers describe what they see between their device and a hosted service. Our role as a cloud computing and web hosting provider is to connect that evidence to domains, SSL certificates, WordPress hosting, shared hosting, cloud hosting, cloud servers, and AWS Partner work. The goal is simple: identify whether the issue sits in naming, trust, hosting, routing, or the application layer.
Domain Registration and SSL Certificates for Reachable and Trusted Websites
Domain registration and SSL certificates shape what users try to reach and whether browsers trust the connection. Traceroute can show the packet path to a domain’s resolved address, but it will not prove that the domain points to the intended place or that the certificate is valid. Those checks belong beside the trace.
When a customer says a site is unreachable, we like to separate the layers. First, does the domain resolve? Next, does the route reach the destination network? After that, does the SSL certificate match the hostname and allow the browser to complete a trusted session?
This layered thinking prevents wasted effort. A perfect trace will not fix a wrong DNS record. A clean route will not repair a certificate mismatch. We want each clue to answer the right question.
WordPress Hosting and Shared Hosting for Everyday Site Performance Checks
WordPress hosting and shared hosting customers can use traceroute to check whether slowness begins before traffic reaches the hosting environment. If a dashboard or storefront feels slow from one office, a trace from that office can reveal local or ISP-side delay. If the trace looks normal, we shift attention to WordPress plugins, themes, caching behavior, database calls, and server-side logs.
Shared environments need careful diagnosis because many factors can look similar from the user’s chair. A slow page might be network latency, heavy PHP work, external scripts, or a remote API. Traceroute helps us avoid blaming hosting when the path is the real issue, and it helps us avoid blaming the path when the application needs attention.
We often ask for the exact time of the test and the user’s location. That context lets us compare trace evidence with hosting logs and performance symptoms.
Cloud Hosting and Cloud Servers for Flexible Network Testing and Scaling
Cloud hosting and cloud servers give teams useful places to run comparison tests. A trace from a customer laptop shows the user path. A trace from a cloud server can show how another network reaches the same destination. If those paths differ, we learn something valuable.
For growing applications, traceroute can also support planning. If many users in one region take long detours, teams may consider architecture, DNS, CDN, or deployment changes. The trace does not make that decision alone, but it gives evidence for the discussion.
As an AWS Partner, 1Byte can also discuss cloud-side testing in environments where AWS is part of the architecture. We keep the focus practical: where are users, where is the service, what path do packets appear to take, and which layer should we test next?







Conclusion
Traceroute is a small tool with a big job: it shows the visible hops between a source and a destination, plus the delay seen at each step. It works by sending probes that expire one hop farther each time, then reading the replies. That makes it excellent for spotting latency jumps, likely break points, routing detours, and CDN path differences.
Still, we should read it with humility. Firewalls, silent routers, load balancing, and different probe types can all distort the picture. A trace is evidence, not a final ruling. The best troubleshooting comes from combining it with DNS checks, ping, port tests, TLS checks, logs, and real user reports.
If your site or server feels slow from one place but fine from another, run a traceroute from both locations and compare the patterns. The next useful question is not “Is the internet broken?” It is “Where does the path start to look different?”