
- What website traffic analysis tools measure and why it matters
- Quick Comparison of website traffic analysis tools
- Top 30 website traffic analysis tools for competitor research and on-site analytics
- How website traffic analysis tools estimate data and why accuracy varies
- Website traffic analysis tools workflows: how to analyze competitors and your own site
- Must-have features checklist for choosing website traffic analysis tools
- Privacy, compliance, and data ownership considerations in website traffic analysis tools
- 1Byte web hosting support for website traffic analysis tools as an AWS Partner
At 1Byte, we host websites that live or die by measured demand. Traffic is not vanity for our customers. It is workload, revenue intent, and a reliability test.
Budgets follow measurability, so measurement stacks keep expanding. Gartner forecasted public cloud end-user spending to reach $723.4 billion, and those workloads include analytics pipelines that never sleep.
Meanwhile, acquisition pressure rises with ad intensity. Statista projects worldwide ad spending to reach US$1.16tn, which makes channel attribution feel less optional each quarter.
We also like to ground “why this matters” in outcomes. McKinsey found intensive users of customer analytics are 23 times more likely to outperform peers on new-customer acquisition, and that is the kind of gap we build systems around.
Still, the hardest part is rarely choosing a dashboard. The hard part is learning what the dashboard is allowed to claim.
In this guide, we map what traffic tools measure, how they estimate, and how we use them in real operations. Along the way, we share the tools we trust and the traps we routinely see.
What website traffic analysis tools measure and why it matters
1. Website traffic definition: visitors as an SEO and growth performance metric
Traffic tools translate raw requests into a business narrative. The cleanest story starts with “who visited” and “what they did.”
In first-party analytics, “visitors” are usually users or devices. In practice, identity is probabilistic, especially across browsers.
We treat visitor counts as directional, not absolute truth. Growth rate matters more than a single day’s headline.
Google Analytics and Matomo are typical baselines for owned measurement. Plausible, Fathom Analytics, Simple Analytics, and Umami shine when teams want simpler truths.
From the SEO side, Google Search Console reframes “visitors” as “searchers.” That pivot matters when rankings move before sessions move.
2. Organic vs paid traffic: how website traffic analysis tools separate acquisition types
Organic and paid are not moral categories. They are cost models with different failure modes.
Organic traffic usually hinges on search intent matching content. Paid traffic often hinges on targeting, creatives, and landing-page relevance.
We separate the streams because fixes differ. A slow page can crush paid efficiency fast.
Semrush, Ahrefs, SpyFu, and Similarweb help us map acquisition pressure outside our own domain. Those views are estimates, but they give context.
On owned sites, we lean on consistent tagging discipline. Without it, paid looks like “direct,” and teams chase ghosts.
3. Traffic sources and channels: understanding where visitors come from
Channel reporting answers a simple question: what sent the visitor. The deeper question is what influenced the visitor.
Referrals are rarely just “partner links.” They can be app embeds, QR scanners, or newsletter platforms.
Direct traffic is also slippery. It often includes untagged campaigns and privacy-stripped referrers.
We recommend building a channel taxonomy early. That keeps “email,” “social,” and “affiliate” from becoming a junk drawer.
When we see spikes, we cross-check edge logs and security telemetry. Bot bursts can masquerade as “viral” if nobody looks.
4. Geography and country trends: spotting markets and regional demand
Geo reports are market research in disguise. They show where demand exists and where performance fails.
CDNs, caching layers, and mobile networks can distort geo if configuration is off. A misrouted edge can inflate certain regions.
We like to overlay geo traffic with latency and error rates. Demand without reliable delivery is a churn factory.
Similarweb is useful for regional competitor posture. Cloudflare Web Analytics can help when you want lightweight, privacy-first visibility at the edge.
For launches, geo trends guide localization priorities. They also guide where we place infrastructure for steadier experiences.
5. Top-performing pages and sections: pages, subdomains, and subfolders that drive visits
Top pages are not just “most viewed.” They are the surface area of your acquisition strategy.
We segment by intent clusters, not only by URL. Blog posts, docs, and pricing pages play different roles.
Subdomains often hide separate products or teams. That can fracture measurement unless naming conventions are consistent.
In migrations, we compare old and new top-page distributions. A sudden change often signals redirect errors or indexation shifts.
Behavior tools like Crazy Egg, Microsoft Clarity, FullStory, and Contentsquare add “why” to “what happened.”
6. Keyword-driven traffic insights: organic keywords and paid keywords
Keyword insights connect language to demand. They help us see what people think they need.
Organic keyword reporting is strongest when you blend sources. Search Console shows query reality, while SEO suites show opportunity.
We use Semrush and Ahrefs for topic expansion and competitive angles. Sistrix, Moz Pro, SE Ranking, and Ubersuggest offer alternate lenses.
Paid keyword research adds cost pressure and creative intent. SpyFu can be helpful when we need fast competitive PPC reconnaissance.
The key is restraint. A keyword list is not a strategy without content, links, and a credible experience.
7. Competitive benchmarking and market share context using website traffic analysis tools
Competitive traffic tools answer uncomfortable questions quickly. They show who is winning attention and where.
We treat estimates as a compass, not a ruler. Precision matters less than directional trends across time.
Similarweb is a common starting point for benchmarking. Semrush and Ahrefs complement it with search and link mechanics.
For link-driven visibility, Majestic can help validate whether “authority” is real. That matters when rankings resist all on-page fixes.
When estimates conflict, we look for consistency across multiple tools. Convergence is usually more actionable than any single claim.
8. Engagement and conversion signals: from session behavior to funnel leaks
Traffic without engagement is noise. Engagement without conversion is often UX debt.
Traditional analytics quantify behavior at scale. Product analytics tools add event-level narratives and user journeys.
Mixpanel, Amplitude, Heap, PostHog, and Pendo are strong when funnels depend on in-app actions. They are less helpful for pure content sites.
For UX friction, we like visual evidence. Session replays and heatmaps reveal dead clicks, hesitation, and rage behavior.
Our strongest wins come from pairing sources. A funnel drop plus a replay is a diagnosis, not a guess.
Quick Comparison of website traffic analysis tools
We rarely see a single tool solve every measurement need. Most mature stacks combine first-party analytics, competitor intelligence, and behavioral evidence.
The table below reflects tools we see used in real operations. We focus on what they are best at, and where they can mislead.
| Tool | Best for | From price | Trial/Free | Key limits |
|---|---|---|---|---|
| Google Analytics | Baseline first-party web analytics | free of charge | Free | Privacy and sampling tradeoffs |
| Matomo | Self-hosted, data ownership analytics | 0 EUR | Self-hosted | Ops burden if self-managed |
| Plausible | Lightweight, privacy-friendly reporting | $9 /month | Trial | Less granular user stitching |
| Crazy Egg | Heatmaps and UX prioritization | $29 /mo | Trial | Not a full attribution suite |
| Microsoft Clarity | Session recordings at scale | Free forever | Free | Needs careful privacy controls |
| Semrush | SEO competitor and keyword research | $139.95/month | Trial | Estimates, not verified analytics |
| Ahrefs | Backlinks and organic opportunity mapping | £99 /mo | Limited free tools | Credit and limit model |
| Similarweb | Traffic benchmarking and market context | $125 | Trial | Third-party estimate uncertainty |
| SpyFu | PPC and competitor ad history | $ 39 /month | Refund policy | Best for search-centric markets |
| Google Search Console | Search performance diagnostics | free of charge | Free | Search only, not full sessions |
Additional Tools We See In Serious Traffic Stacks
Beyond the table, these tools regularly show up in real measurement programs. Each fills a specific gap, so we pick them for purpose.
- Adobe Analytics for enterprise-grade segmentation and governance.
- Fathom Analytics for privacy-first simplicity with paid support.
- Simple Analytics for clean reports and EU-centric data handling.
- Umami for open-source teams that want a simple UI.
- Cloudflare Web Analytics for edge visibility with minimal client overhead.
- Mixpanel for event funnels tied to product activation.
- Amplitude for behavioral cohorts and lifecycle analysis.
- Heap for autocapture workflows and fast retroactive questions.
- PostHog for product analytics with feature flags in one place.
- Pendo for product adoption insights and in-app guidance.
- Hotjar for UX signals that pair well with traditional analytics.
- FullStory for high-fidelity replay and troubleshooting workflows.
- Contentsquare for digital experience analytics at enterprise depth.
- Mouseflow for replay, funnels, and friction detection.
- Lucky Orange for behavior analytics with chat and feedback.
- Moz Pro for approachable SEO tracking and content discovery.
- SE Ranking for rank tracking with agency-friendly reporting.
- Sistrix for visibility indexing, especially in European SERPs.
- Ubersuggest for lighter-weight keyword expansion and audits.
- Majestic for link graph validation and trust signals.
Top 30 website traffic analysis tools for competitor research and on-site analytics
Traffic tools are easy to demo and hard to trust. So we score them like buyers actually buy. We start with the job: competitor research, on-site behavior, or full-funnel attribution. Then we pressure-test the workflow: can you get to a decision in one sitting, or does it sprawl?
Each pick gets a weighted score on a 0–5 scale. Value-for-money and feature depth carry the most weight. Setup, integrations, UX, security posture, and support round it out. We also look for “time-to-first-value,” because analytics that never ships is just guilt.
Pricing notes reflect published entry points when available. For sales-led products, we label pricing as “reported” when vendors do not post list rates. Limits matter as much as dollars. So each mini-review calls out the caps that usually bite first.
1. Semrush
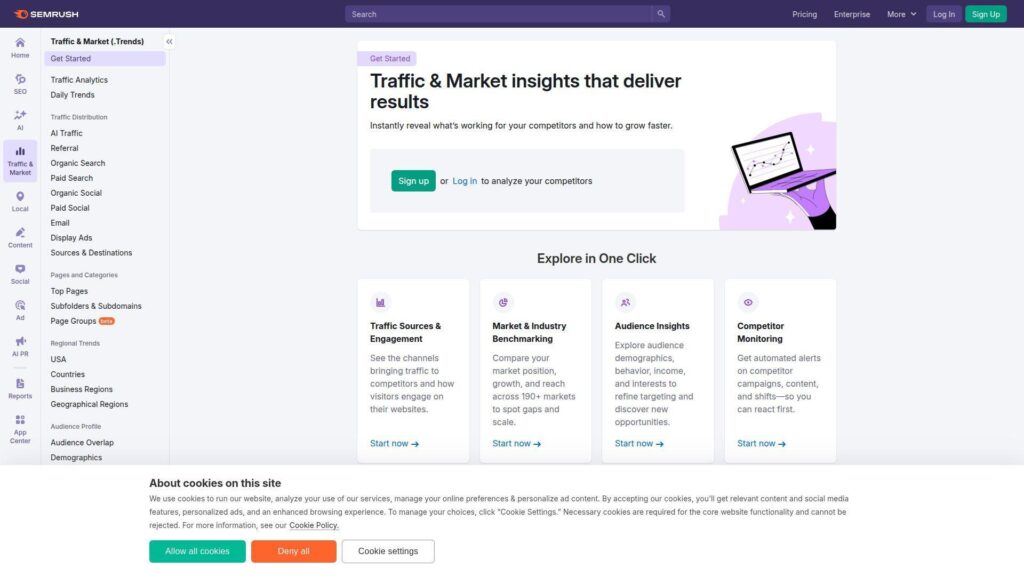
Semrush is a long-running marketing software company with deep search and competitive data. Its product teams keep expanding beyond SEO into market and AI visibility workflows.
Tagline: Turn competitor traffic clues into a weekly growth plan.
Best for: SEO leads and small agency teams who need one platform for research.
- Domain and keyword workflows → spot rival growth bets, then mirror what works.
- Reports and add-ons → automate weekly exports, saving 30–60 minutes per client.
- Guided projects setup → reach first useful audit in about 30 minutes.
Pricing & limits: From $139.95/mo; Trial: 7 days; Caps: 5 projects, 500 tracked keywords, 100,000 pages crawled monthly. Extra users are an added monthly fee.
Downside: Costs climb fast once you need more seats or add toolkits. Also, data breadth can feel like noise without a tight reporting routine.
Verdict: If you need competitor research plus on-site cleanup, this helps you ship a prioritized backlog in a week. Beats Ubersuggest on depth; trails Matomo on first-party ownership.
Score: 4.5/5
2. Similarweb
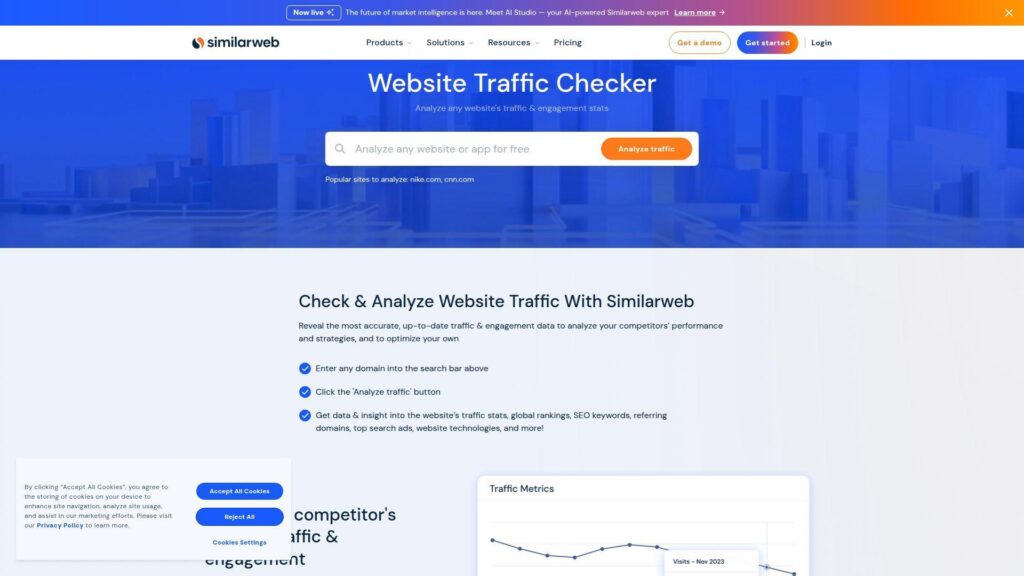
Similarweb is built around digital market intelligence at scale. The team’s focus is clear: answer “who’s winning online” without needing anyone’s internal analytics.
Tagline: Estimate competitor traffic, channels, and momentum in minutes.
Best for: market researchers and performance marketers planning channel bets.
- Traffic and engagement estimates → size competitors, then pick realistic targets.
- Competitor alerts → cut manual checking to one dashboard, saving several weekly lookups.
- Self-serve packages → get first benchmark set in about 15 minutes.
Pricing & limits: From $125/mo billed annually (or $199 monthly); Trial: 7 days; Caps: 1 user and 3 months of historical data on entry packages. Trial actions can be limited per day.
Downside: It is expensive for casual use and exports can feel gated. Also, estimates can diverge from reality on smaller sites.
Verdict: If you need a top-down traffic story for a market map, this gets you there in an afternoon. Beats Semrush at broad market context; trails Ahrefs on backlink granularity.
Score: 4.3/5
3. Ahrefs
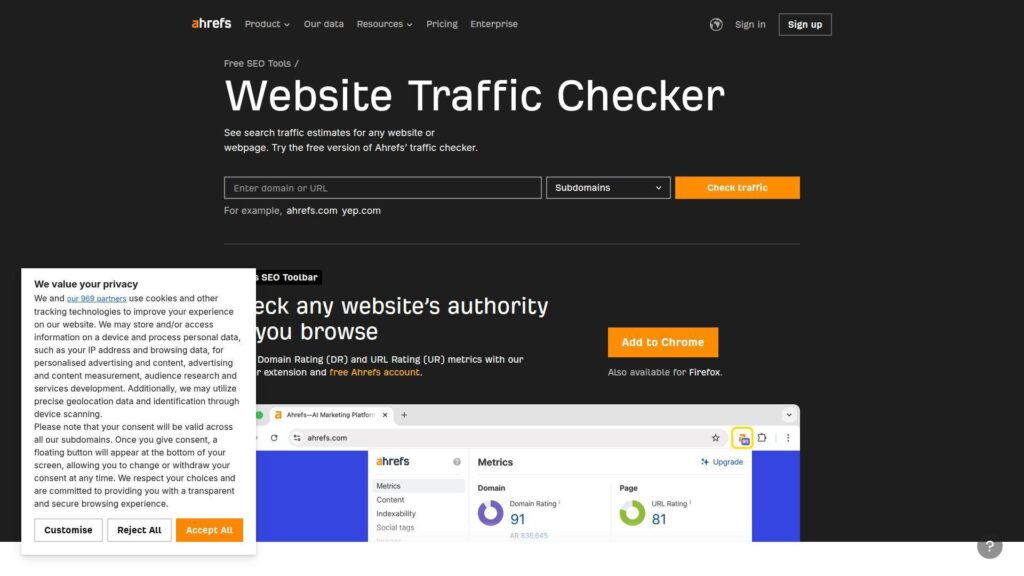
Ahrefs is an SEO-first company known for its crawler and research tooling. The team keeps tightening workflows around competitor discovery and technical prioritization.
Tagline: Find why they rank, then take the traffic they’re leaking.
Best for: in-house SEOs and content teams who live inside search data.
- Site and keyword research loops → identify traffic pages, then clone intent patterns.
- Projects plus audits → reduce manual checks by batching issues into one crawl run.
- Clean UX for core reports → reach first competitor snapshot in about 10 minutes.
Pricing & limits: From £23/mo for Starter or £99/mo for Lite; Trial: no free trial stated; Caps: Starter is credit-based with limited usage, while Lite includes 5 projects and 750 tracked keywords.
Downside: Credit systems can feel like a meter running in the background. Also, add-on users and upgrades get pricey quickly.
Verdict: If your goal is SEO-driven competitor traffic capture, this helps you map opportunities in days, not weeks. Beats Serpstat on link depth; trails Semrush on all-in-one breadth.
Score: 4.4/5
4. SE Ranking
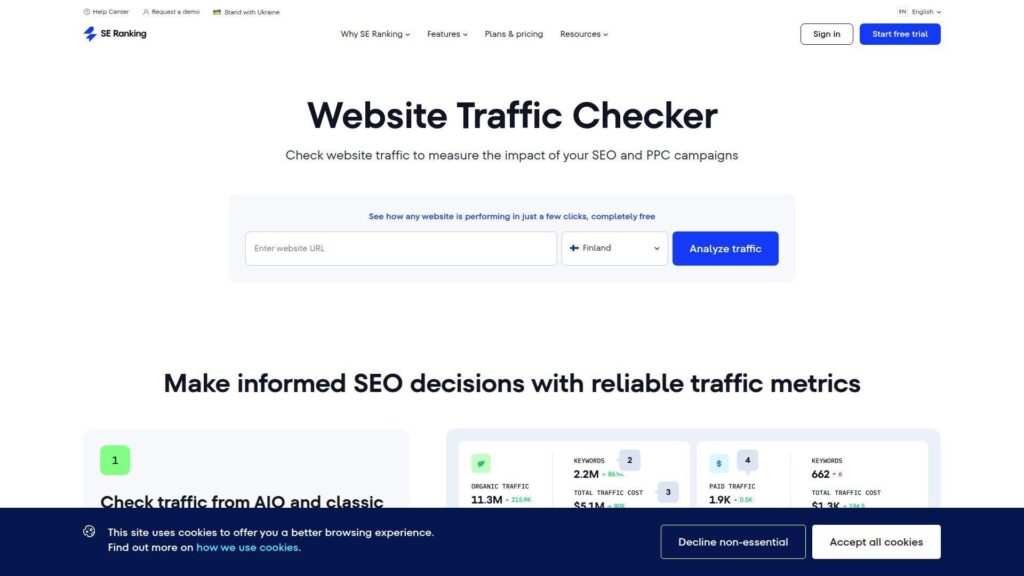
SE Ranking positions itself as an SEO platform with strong value and modern reporting. The team has leaned into automation and collaboration for agencies.
Tagline: Run repeatable SEO ops without paying enterprise taxes.
Best for: small agencies and lean marketing teams managing multiple sites.
- Projects with rank tracking and audits → keep client baselines current, without spreadsheet chaos.
- Looker Studio and GA integrations → cut reporting steps by 3–5 clicks per update.
- Trial onboarding flow → reach first tracked keywords in about 20 minutes.
Pricing & limits: From $129/mo (or $103.20/mo billed annually); Trial: 14 days; Caps: Core includes 10 projects, 2,000 daily tracked keywords, and 250,000 audit pages monthly.
Downside: Some deeper competitive filters still trail Ahrefs. Also, advanced agency workflows can require add-ons and higher tiers.
Verdict: If you want a practical SEO cockpit, this helps you deliver client-ready insights within a week. Beats Semrush on price-to-capacity; trails Semrush on dataset breadth.
Score: 4.2/5
5. Matomo
Matomo is built around privacy-first analytics with strong data ownership. The team supports both cloud hosting and self-hosting, which changes who controls the story.
Tagline: Own your analytics data, then act on it with confidence.
Best for: privacy-minded orgs and teams needing first-party, compliant tracking.
- First-party analytics stack → keep raw data under your control, reducing vendor lock-in risk.
- Tag Manager and import tools → consolidate tracking, saving several scripts and handoffs.
- Cloud trial setup → see real-time visits in about 30 minutes.
Pricing & limits: From 29/mo for Matomo Cloud entry tier; Trial: 21 days; Caps: entry cloud tier is sized by monthly hits and includes allowance limits. On-Premise software is free, but you own hosting and upkeep.
Downside: Self-hosting needs real technical ownership and monitoring. Also, some premium features are add-ons for On-Premise installs.
Verdict: If your goal is compliant on-site analytics without data sampling, this helps you get trustworthy reporting within days. Beats GA on ownership; trails GA on plug-and-play ad ecosystem links.
Score: 4.2/5
6. Google Analytics

Google Analytics is the default analytics layer for many sites, with deep platform reach. The team keeps expanding event-based reporting and ecosystem ties.
Tagline: See what users do, then fix the pages that bleed conversions.
Best for: SMB marketers and product teams needing mainstream web analytics.
- Acquisition and behavior reporting → identify top channels and broken journeys quickly.
- Google ecosystem ties → reduce UTM and ad reporting steps across Google tools.
- Fast deployment via tags → reach first pageview data in about 15 minutes.
Pricing & limits: From $0/mo; Trial: free forever; Caps: advanced support, SLAs, and some enterprise capabilities require a paid enterprise edition. Quotas can apply to some exports and APIs.
Downside: Setup is easy, but “correct setup” is not. Also, privacy expectations can demand extra consent and governance work.
Verdict: If you need a free baseline for on-site analytics, this helps you answer core traffic questions the same day. Beats most tools on ecosystem reach; trails Matomo on ownership optics.
Score: 4.1/5
7. Serpstat
Serpstat is an SEO platform aimed at practical, budget-aware teams. The team focuses on core research, rank tracking, and audits without overcomplication.
Tagline: Turn competitor SEO signals into a prioritized content list.
Best for: freelancers and small teams that need affordable competitive research.
- Keyword and domain research → uncover content gaps, then build pages with intent focus.
- API and scheduled reports on higher tiers → save recurring exports and manual screenshots.
- Quick projects model → hit first useful audit in about 30 minutes.
Pricing & limits: From $50/mo; Trial: 7 days; Caps: Individual includes 5 projects, 100 daily searches, and 30,000 audit pages.
Downside: Data depth can feel lighter than the biggest two SEO suites. Also, some advanced workflows sit behind higher plans.
Verdict: If your goal is competitor-aware SEO planning on a budget, this helps you ship a monthly content plan in a day. Beats bigger suites on cost; trails Ahrefs on link intelligence.
Score: 3.9/5
8. Fathom Analytics
Fathom is a small, opinionated analytics company focused on simplicity and privacy. The team optimizes for clarity, not endless configuration.
Tagline: Get clean traffic truth without cookie-banner gymnastics.
Best for: solo marketers and small product teams wanting lightweight site analytics.
- Simple dashboards → answer “what’s working” without digging through nested menus.
- Email reports and exports → save a few manual check-ins each week.
- One-script install → reach first data in about 10 minutes.
Pricing & limits: From $15/mo; Trial: 7 days; Caps: pricing is based on average monthly pageviews, and plans can upgrade when you exceed limits.
Downside: It will not replace deep product analytics or attribution modeling. Also, competitor research is not the point here.
Verdict: If you want privacy-friendly on-site analytics you will actually read, this helps you settle weekly reporting in one hour. Beats GA on simplicity; trails GA on ecosystem integrations.
Score: 4.0/5
9. Mixpanel
Mixpanel is a product analytics company built around event-driven behavior analysis. The team’s north star is self-serve answers for product and growth.
Tagline: Turn click trails into retention wins you can measure.
Best for: product teams and growth analysts working on funnels and cohorts.
- Funnels, cohorts, and flows → pinpoint drop-offs, then validate fixes with repeatable reports.
- Usage-based Growth pricing → avoid plan jumps, saving budget planning steps each quarter.
- Free plan on-ramp → reach first funnel report in about 1–2 hours.
Pricing & limits: From $0/mo; Trial: free plan is free forever; Caps: Free is capped at 1M monthly events and 10K monthly session replays. Growth charges after 1M events, at $0.28 per 1K events.
Downside: Costs can spike with event-heavy instrumentation. Also, governance needs discipline, or your taxonomy becomes junk.
Verdict: If you need product-grade behavior analytics, this helps you find one meaningful funnel fix within a week. Beats GA on product workflows; trails Amplitude on bundled feature breadth.
Score: 4.3/5
10. Kissmetrics
Kissmetrics is built for customer journey analytics and revenue-minded reporting. The team leans into event tracking that ties behavior to outcomes.
Tagline: See the path to purchase, then remove the friction.
Best for: SaaS teams and ecommerce marketers focused on conversion journeys.
- People-based analytics → follow users across sessions, improving lifecycle visibility.
- Revenue and cohort views → cut manual SQL pulls and recurring spreadsheet merges.
- Guided onboarding → reach first tracked events in about 1–2 days.
Pricing & limits: From $125.99/mo; Trial: 14 days; Caps: entry build-your-own plan starts at 1M events monthly. Tiered plans cap events, seats, and tracked domains.
Downside: It can feel pricey versus newer, usage-based competitors. Also, implementation quality determines whether you get truth or theater.
Verdict: If you want journey analytics that speaks revenue, this helps you find conversion leaks within a month. Beats basic analytics on identity; trails Mixpanel on modern pricing flexibility.
Score: 3.8/5
11. Adobe Analytics
Adobe Analytics sits inside Adobe’s enterprise experience stack. The teams behind it build for complex orgs that need governance, scale, and deep analysis.
Tagline: Make enterprise-grade analytics your competitive advantage.
Best for: enterprise analytics teams and large brands with complex data needs.
- Advanced analysis workspace → answer messy questions without rebuilding dashboards weekly.
- Experience Cloud ties → reduce stitching work across marketing and journey tooling.
- Implementation partners ecosystem → reach first robust reporting in weeks, not quarters.
Pricing & limits: From about $8,333/mo (reported entry licensing); Trial: “try for free” is offered, but duration is not publicly stated; Caps: pricing and limits often depend on server calls, users, and data retention.
Downside: Budget and complexity are real deal-breakers. Also, the learning curve can slow adoption outside specialist teams.
Verdict: If you need governed analytics at scale, this helps you standardize reporting in a quarter. Beats GA on enterprise governance; trails GA on low-friction setup.
Score: 3.7/5
12. Hotjar
Hotjar’s classic tools now live under Contentsquare’s wider product suite. The teams focus on qualitative truth: what users actually did on your pages.
Tagline: Watch the friction, then fix it with proof.
Best for: UX teams and conversion marketers diagnosing on-page problems.
- Session replay and heatmaps → stop guessing why people bounce or stall.
- Funnels and monitoring in newer free tiers → skip tool-hopping, saving setup steps.
- Tag-based install → get first recordings in about 30 minutes.
Pricing & limits: From $0/mo; Trial: free plan is ongoing; Caps: plan limits are typically based on sessions and data access windows. Paid plans vary by suite and scale, with Growth starting from $99 on some bundles.
Downside: Sampling can limit confidence on mid-tier plans. Also, privacy and masking require careful configuration on sensitive pages.
Verdict: If you want fast answers on user friction, this helps you ship a conversion fix in a week. Beats GA at “why”; trails GA at channel attribution.
Score: 4.0/5
13. Plausible Analytics
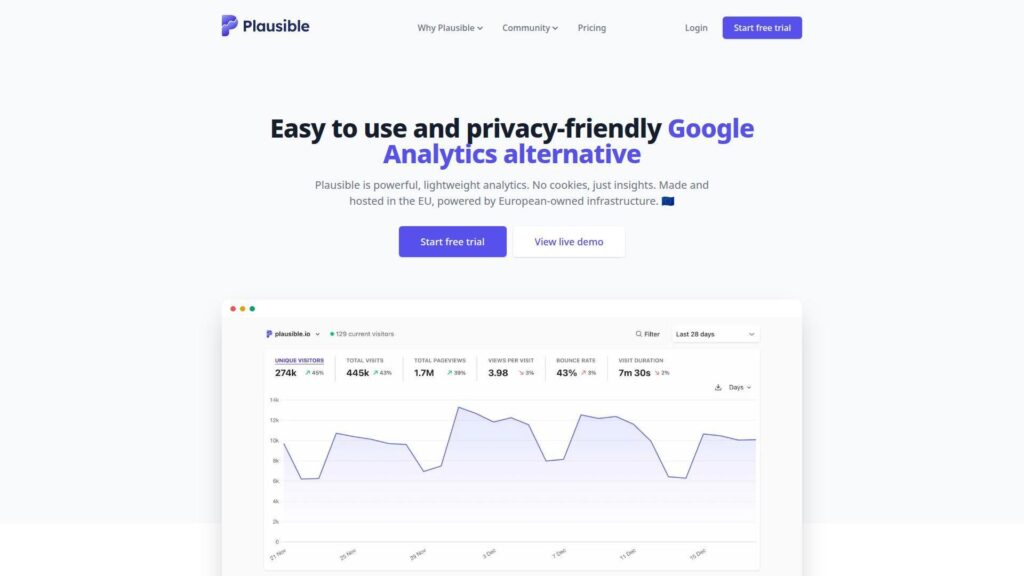
Plausible is a privacy-focused analytics company with an open-source core. The team aims for simple, credible reporting without surveillance vibes.
Tagline: Get traffic clarity without bloated dashboards or cookies.
Best for: founders and content teams wanting lightweight, privacy-friendly analytics.
- Clean source and page reporting → make weekly content decisions without analyst help.
- Search Console integration → cut context switching, saving a few manual joins per report.
- Quick install and sane defaults → reach first value in about 10 minutes.
Pricing & limits: From $9/mo; Trial: 30 days; Caps: Growth includes 100k monthly pageviews, unlimited websites, and 3 team members.
Downside: Deep user-level product analytics is not its mission. Also, some advanced funnels and ecommerce features sit in higher tiers.
Verdict: If you want honest, lightweight web analytics, this helps you keep reporting consistent every week. Beats GA on simplicity; trails GA on advanced event ecosystems.
Score: 4.2/5
14. Piwik PRO
Piwik PRO is built for teams that need analytics plus compliance tooling in one place. The product group emphasizes governance, retention controls, and regulated use cases.
Tagline: Run analytics that your legal team won’t hate.
Best for: healthcare, finance, and public-sector teams with strict compliance needs.
- Analytics plus consent tooling → reduce vendor sprawl and compliance handoffs.
- Actions-based pricing → align spend to real usage, not vague “features.”
- Guided onboarding → see first reports in about 1–2 hours.
Pricing & limits: From €35/mo; Trial: 30 days; Caps: Business includes up to 20 domains and up to 2M actions monthly, with 25 months retention. The prior free Core plan has an announced end date of February 28.
Downside: If you only need basic dashboards, it can feel heavy. Also, multi-module breadth raises setup decisions early.
Verdict: If you need compliant analytics with strong controls, this helps you launch tracking without months of policy debate. Beats GA on compliance packaging; trails GA on ubiquity.
Score: 4.1/5
15. Amplitude
Amplitude is a product analytics company built for behavioral insight at scale. The team bundles analytics, experimentation, and activation into one platform.
Tagline: Turn product usage into retention and revenue lift.
Best for: product managers and growth teams scaling beyond basic web analytics.
- Event analytics and cohorts → identify retention drivers, then double down with confidence.
- Activation and destinations → cut export-and-upload loops, saving a few steps per campaign.
- Starter plan setup → reach first dashboards in about a day.
Pricing & limits: From $0/mo; Trial: free Starter plan is ongoing; Caps: Starter includes 10K MTUs and up to 10M events. Plus starts at $49/mo with higher MTU tiers.
Downside: Taxonomy discipline is mandatory, or dashboards drift into nonsense. Also, cross-team governance can take real process work.
Verdict: If you want product analytics that drives action, this helps you ship measurable improvements within a month. Beats GA on product depth; trails Mixpanel on simple cost predictability.
Score: 4.2/5
16. WP-Statistics
WP Statistics is a WordPress-first analytics plugin built for site owners who want control. The team leans into privacy-friendly, cookie-less tracking inside WordPress.
Tagline: Get WordPress analytics without sending data elsewhere.
Best for: WordPress publishers and SMB site owners who prefer plugin-native tooling.
- On-site dashboards → check traffic without logging into a separate SaaS tool.
- Privacy toolkit and role access → reduce admin back-and-forth when teams need reporting.
- Plugin install path → hit first reports in about 10 minutes.
Pricing & limits: From $0/mo; Trial: no trial, but a 14-day money-back guarantee; Caps: Premium is $119/year for 1 site, while the free plugin supports unlimited sites with core features.
Downside: Competitor research is out of scope. Also, advanced analytics features require paid tiers and add-ons.
Verdict: If you want WordPress-native traffic reporting, this helps you get basic insights the same day. Beats GA on self-contained control; trails GA on ecosystem integrations.
Score: 3.8/5
17. Clicky
Clicky is a veteran web analytics product with a straightforward, real-time mindset. The team keeps the product simple, with practical features and clear pricing.
Tagline: See visitors live, then respond while it still matters.
Best for: small site owners and support teams needing real-time visibility.
- Real-time visitor views → catch traffic spikes and broken pages quickly.
- Premium trial defaults → evaluate full features without sales calls, saving procurement time.
- Low-friction setup → reach first data in about 10 minutes.
Pricing & limits: From $9.99/mo; Trial: 21 days; Caps: trial includes up to 3 sites and up to 1,000,000 daily pageviews total. Paid plans cap tracked sites and daily pageviews.
Downside: UI can feel dated compared to newer analytics tools. Also, deep product analytics and cohorts are not its strongest lane.
Verdict: If you want real-time web analytics without complexity, this helps you get monitoring in place today. Beats many tools on clarity; trails Mixpanel on event analytics depth.
Score: 3.9/5
18. Neil Patel Website Traffic Checker
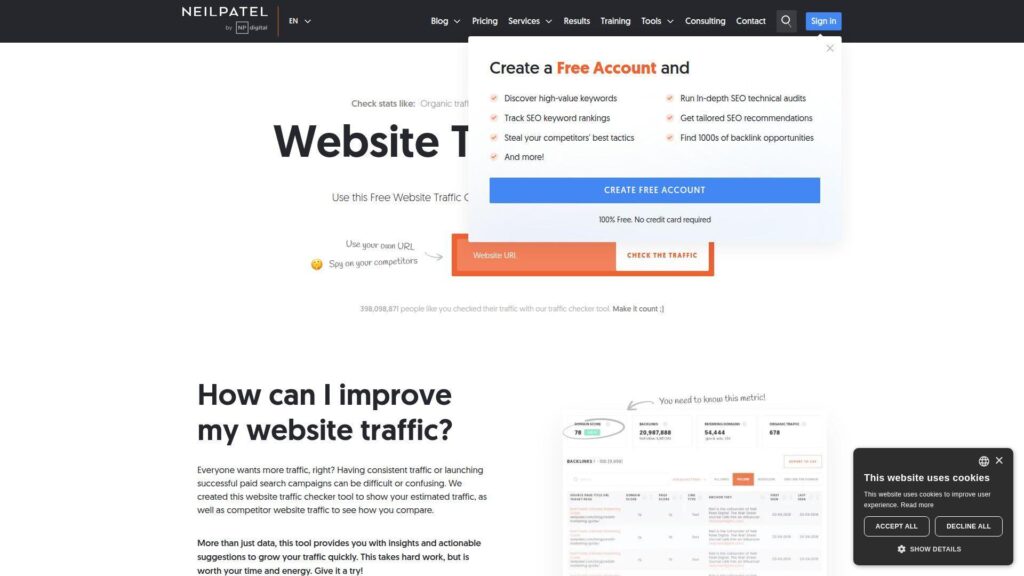
Neil Patel’s traffic checker is a free, top-of-funnel tool powered by the Ubersuggest ecosystem. The team’s focus is fast estimates and quick SEO next steps.
Tagline: Get a competitor traffic estimate, then pick your next keyword.
Best for: solo marketers and founders doing quick competitive spot-checks.
- Domain traffic estimation → get directional benchmarks for organic traffic planning.
- Ubersuggest upgrade path → save research steps by moving from check to tracking.
- No-setup web tool → reach first result in under 2 minutes.
Pricing & limits: From $0/mo; Trial: tool is free; Caps: deeper features typically require Ubersuggest, with plans from $29/mo and a 7-day free trial. Paid tiers add tracked projects, keywords, and higher daily searches.
Downside: Estimates are directional, not ground truth. Also, serious teams will outgrow the free workflow quickly.
Verdict: If you need a quick “is this competitor big” answer, this helps you decide in minutes. Beats manual guessing; trails Similarweb on market-grade breadth.
Score: 3.7/5
19. AnswerThePublic
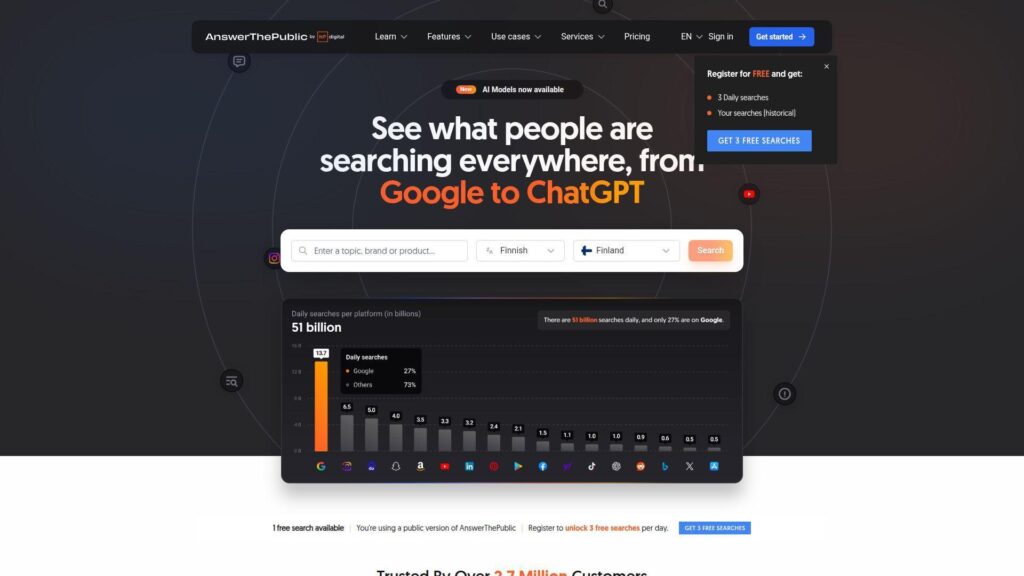
AnswerThePublic is built for search listening and content ideation. The product team leans into visual keyword discovery and monitoring over time.
Tagline: Turn questions people ask into content that earns traffic.
Best for: content strategists and SEO writers building topic clusters.
- Question and intent maps → build briefs that match real search language.
- Alerts and monitoring → reduce repeat research runs, saving a few searches weekly.
- Simple UI for exploration → get first useful cluster in about 10 minutes.
Pricing & limits: From $20/mo; Trial: 7 days on monthly plans; Caps: Starter includes 100 searches per month and 1 user. Free accounts have daily search limits.
Downside: It is not a full traffic analytics suite. Also, you still need another tool to validate ranking difficulty and backlinks.
Verdict: If you want content ideas with real query flavor, this helps you outline a month of posts in a day. Beats generic keyword lists on creativity; trails Semrush on end-to-end execution.
Score: 3.8/5
20. HubSpot

HubSpot is a CRM and marketing platform with built-in reporting across the funnel. The teams build for marketers who want attribution that connects to leads.
Tagline: Connect traffic to contacts, then prove what drove revenue.
Best for: SMB marketing teams and demand gen leads needing closed-loop reporting.
- Contact-tied analytics → move from pageviews to pipeline impact in one system.
- Automation and nurturing → reduce manual follow-ups by triggering emails and tasks.
- Quick start with free tools → see lead capture basics in about a day.
Pricing & limits: From $0/mo; Trial: free tools are ongoing; Caps: Marketing Hub Starter starts at $20/month per seat, while higher tiers add seats, onboarding fees, and marketing contact limits.
Downside: Total cost rises with contacts and hubs, not just seats. Also, you may pay for breadth you do not fully use.
Verdict: If you need to tie web traffic to CRM outcomes, this helps you build an attribution story within a month. Beats standalone analytics on lifecycle linkage; trails GA on zero-cost scale.
Score: 4.0/5
21. Salesforce
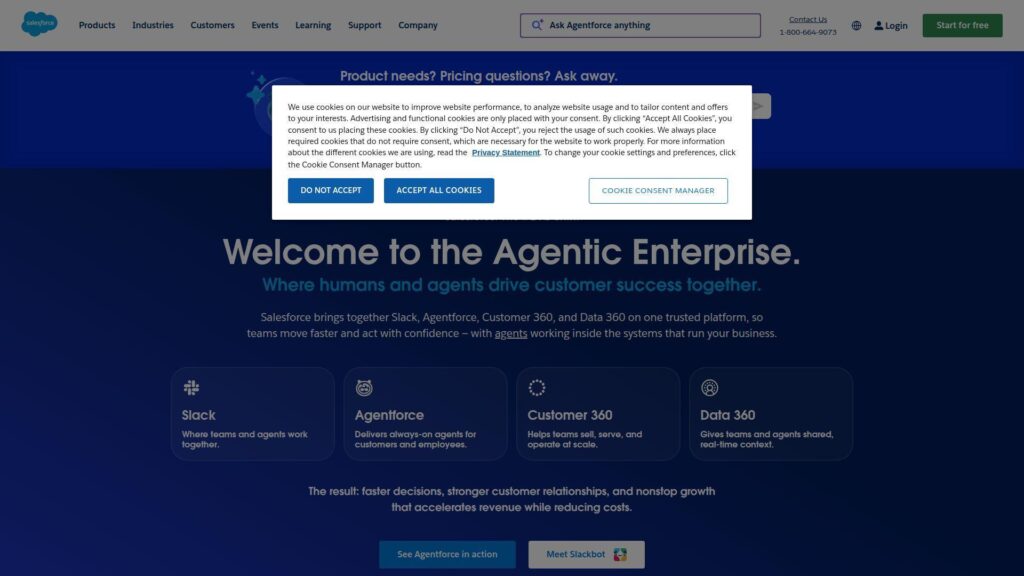
Salesforce is a CRM platform with a huge ecosystem and deep customization. Its teams focus on operational workflows, reporting, and enterprise-grade controls.
Tagline: Turn web interest into a tracked, repeatable sales motion.
Best for: sales ops teams and revenue leaders closing the loop on acquisition.
- Pipeline reporting → connect marketing traffic to stage movement and forecast changes.
- AppExchange integrations → reduce manual syncing, saving repeated import steps.
- Guided trials → get a basic pipeline live in a few hours.
Pricing & limits: From $0 user/month for Free Suite; Trial: 30 days; Caps: Starter Suite is $25 user/month, with higher editions increasing cost per user. Features and API access expand by edition, with some add-ons priced separately.
Downside: It is not a competitor traffic tool on its own. Also, setup can sprawl without a strong admin and a clear data model.
Verdict: If you need CRM-grade attribution and workflow, this helps you operationalize lead handling within a quarter. Beats spreadsheets on governance; trails HubSpot on marketer-first simplicity.
Score: 3.9/5
22. Marketo
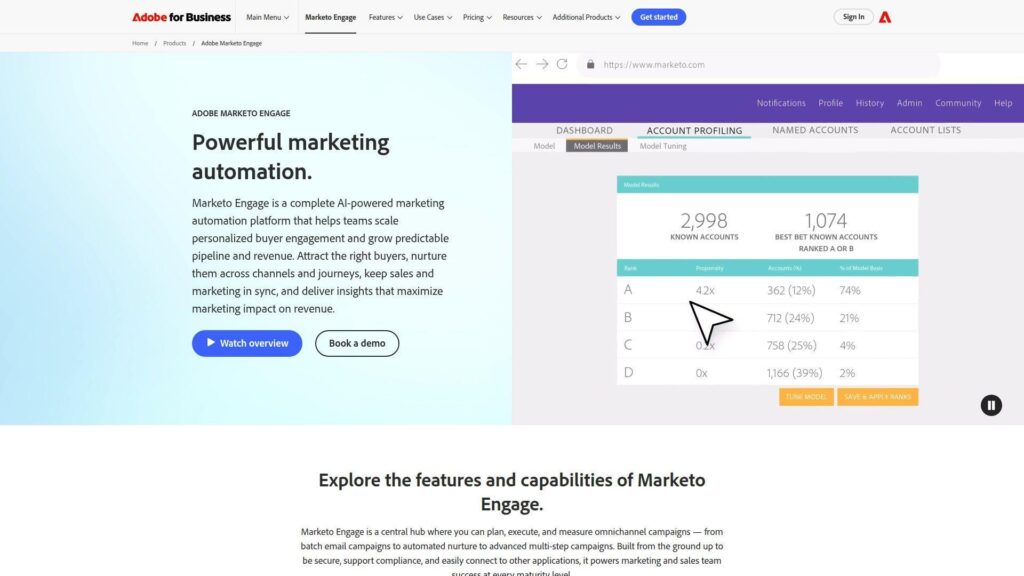
Adobe Marketo Engage is built for B2B marketing automation at enterprise scale. The product teams emphasize lead management, CRM sync, and account-based execution.
Tagline: Automate B2B demand, then measure what actually moved accounts.
Best for: enterprise demand gen teams and ABM programs running complex journeys.
- Lead and account automation → reduce manual campaign ops across large databases.
- Native CRM integrations → cut duplicate entry and sync work across sales and marketing.
- Packaged capabilities by tier → reach first nurture journeys in a few weeks.
Pricing & limits: From about $895/mo (reported); Trial: no public self-serve trial duration stated, with demos via sales; Caps: packaging can include user limits like 10 or 25 users, and API call ceilings by tier.
Downside: Pricing is sales-led and can be hard to forecast. Also, implementation often needs specialist resources to avoid misfires.
Verdict: If you need enterprise B2B automation tied to CRM reality, this helps you standardize demand ops in a quarter. Beats Mailchimp on B2B depth; trails HubSpot on self-serve pricing clarity.
Score: 3.7/5
23. Optimizely
Optimizely is an experimentation and digital experience platform with a strong optimization heritage. The teams focus on testing, personalization, and structured decision-making.
Tagline: Test your way to higher conversion, with less opinion noise.
Best for: CRO teams and product orgs running serious A/B testing programs.
- Experimentation workflows → prove uplift before rolling changes site-wide.
- Integrations to analytics stacks → reduce analysis handoffs and repeated exports.
- Program scaffolding → reach first controlled test in about 1–2 weeks.
Pricing & limits: From about $249/mo (reported); Trial: available upon request, with no public duration; Caps: limits are typically based on traffic volume, features, and governance needs.
Downside: It is rarely “cheap,” and procurement can take time. Also, you need enough traffic to get clean results.
Verdict: If you want conversion improvements you can defend, this helps you run a reliable test cycle within a month. Beats Hotjar on proof; trails Hotjar on quick qualitative insight.
Score: 4.0/5
24. Mailchimp
Mailchimp is an email marketing platform under Intuit, built for broad SMB adoption. The product teams focus on campaigns, automations, and audience management.
Tagline: Send smarter emails, then measure what drove clicks and sales.
Best for: small ecommerce brands and solo marketers running email-led growth.
- Automations and journeys → increase repeat purchases without manual follow-up.
- Integrations with storefronts → cut CSV imports, saving steps every campaign.
- Template-first UX → launch your first campaign in about an hour.
Pricing & limits: From $0/mo; Trial: 14 days for Standard or Essentials; Caps: free plan includes 250 contacts and 500 email sends monthly. Paid plans scale with contacts and have send limits and overages.
Downside: Costs rise as lists grow, and advanced features can sit behind higher tiers. Also, it is not a competitor traffic intelligence tool.
Verdict: If you want email performance tied to audience growth, this helps you improve campaigns within weeks. Beats basic ESPs on ecosystem; trails HubSpot on full-funnel CRM linkage.
Score: 4.0/5
25. Zapier
Zapier is an automation platform with a massive integrations footprint. The team’s mission is simple: move data between tools so humans can stop doing it.
Tagline: Automate the reporting busywork, then spend time on decisions.
Best for: operations-minded marketers and small teams stitching a stack together.
- Workflow automation → push leads and events where they belong, without manual entry.
- Webhooks and premium apps → remove 3–6 copy steps per workflow run.
- Template-driven setup → get first Zap live in about 15 minutes.
Pricing & limits: From $0/mo; Trial: free plan is free forever; Caps: Free includes 100 tasks per month and two-step Zaps. Professional starts at $19.99/mo billed annually, with task tiers scaling.
Downside: It is not analytics by itself, so you still need a source of truth. Also, task-based pricing can surprise teams with high-volume workflows.
Verdict: If you want traffic and lead data to land in the right tools automatically, this helps you clean up ops in a day. Beats manual exports at scale; trails native integrations on speed.
Score: 4.1/5
26. Shopify

Shopify is an ecommerce platform with built-in store analytics and reporting. The product teams focus on getting merchants from setup to sales fast.
Tagline: Track store traffic and sales, then optimize the funnel that pays you.
Best for: ecommerce founders and small teams running a direct-to-consumer store.
- Store analytics dashboards → spot conversion dips and top channels without extra tooling.
- App ecosystem and pixels → reduce tracking setup steps across ads and email tools.
- Fast store launch flow → reach first orders and data in days, not weeks.
Pricing & limits: From $29 USD/month billed yearly; Trial: starts free, then $1/month for 3 months promo for new users; Caps: staff accounts and advanced reporting expand by plan, with Plus on longer terms.
Downside: Analytics are commerce-centric, not competitor intelligence. Also, app costs can quietly become your second subscription stack.
Verdict: If you need ecommerce analytics tied to actual checkout behavior, this helps you diagnose funnel issues within a week. Beats generic site analytics on sales linkage; trails GA on broader web reporting flexibility.
Score: 4.0/5
27. ClickFunnels

ClickFunnels is a funnel-building platform with marketing automation features baked in. The team optimizes for speed: launch pages, capture leads, and measure performance.
Tagline: Launch funnels fast, then track what converts.
Best for: creators and small marketing teams selling offers via landing pages.
- Funnel templates and tracking → move from idea to measurable funnel quickly.
- Email and contacts in one plan → save tool switching and list syncing steps.
- Hosted setup path → reach first live funnel in about a day.
Pricing & limits: From $97/mo; Trial: free trial is available, and the product references a 14-day trial plus a 30-day money-back window; Caps: Launch includes 10K contacts, 50K emails per month, and 1 workspace.
Downside: It is not a deep analytics suite, so attribution can feel thin. Also, complex brands may outgrow the templated approach.
Verdict: If you want to ship a conversion-focused funnel quickly, this helps you test an offer within a week. Beats DIY page stacks on speed; trails HubSpot on lifecycle reporting depth.
Score: 3.9/5
28. Adverity
Adverity is a data integration and reporting platform built for marketing data pipelines. The team’s focus is unifying messy channel data into something BI can trust.
Tagline: Centralize marketing data, then report once with confidence.
Best for: performance marketing teams and analysts wrangling multi-source reporting.
- Connectors and transformations → reduce spreadsheet stitching and fragile macros.
- Row-based allowances → keep reporting scalable by paying for real data volume.
- Trial access to Standard features → reach first unified dataset in about a week.
Pricing & limits: From $500/mo; Trial: 14 days; Caps: trial includes a lower unique data row allowance, and published guidance references 100,000 free unique data rows in trial. Standard includes 200,000 free rows and 1 workspace.
Downside: You still need a BI layer or dashboarding plan to tell the story. Also, setup requires clear data definitions to avoid “garbage in” outcomes.
Verdict: If you need one source of truth for marketing performance, this helps you stabilize reporting within a month. Beats Zapier for data shaping; trails Zapier for quick one-off automations.
Score: 4.0/5
29. SimilarTech
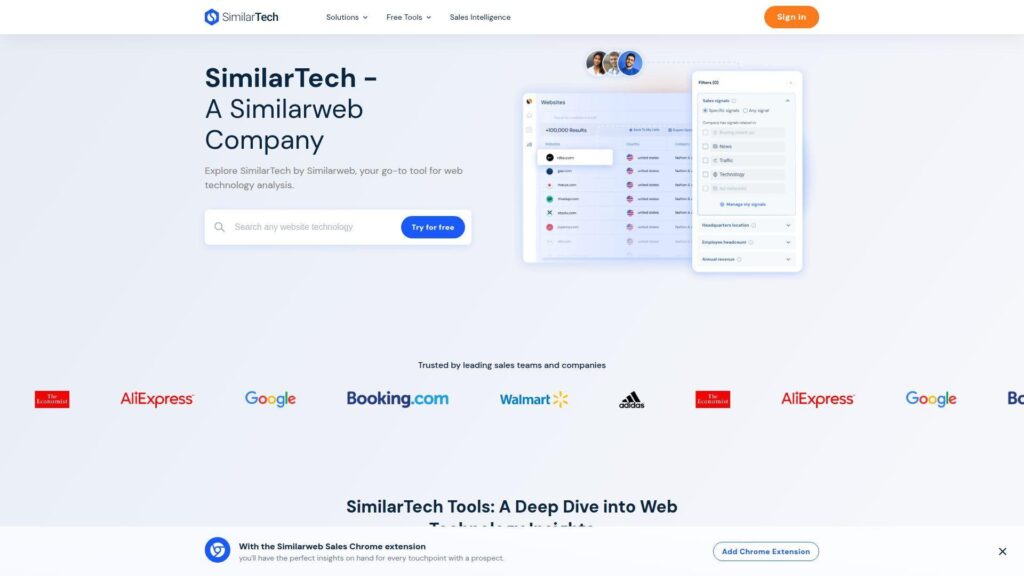
SimilarTech is aimed at technographics and competitive intelligence around what sites are built with. The team’s value is fast detection, then lists you can act on.
Tagline: Find who uses what tech, then target the right accounts.
Best for: sales teams and partner marketers doing stack-based prospecting.
- Technology detection → qualify leads by stack fit, improving outreach targeting.
- Competitive stack comparisons → reduce manual checks by batching lookups.
- Browser-first discovery → reach first insights in about 5 minutes.
Pricing & limits: From about $290/mo (reported in third-party listings); Trial: free version and free trial are listed, with no public trial duration stated; Caps: usage limits depend on plan and lookup volume.
Downside: This is not a traffic analytics platform, so pair it with a traffic tool. Also, list quality varies by niche and data availability.
Verdict: If you want stack-based competitor and prospect research, this helps you build a target list in a day. Beats generic scraping on speed; trails Similarweb on traffic context.
Score: 3.6/5
30. Planable
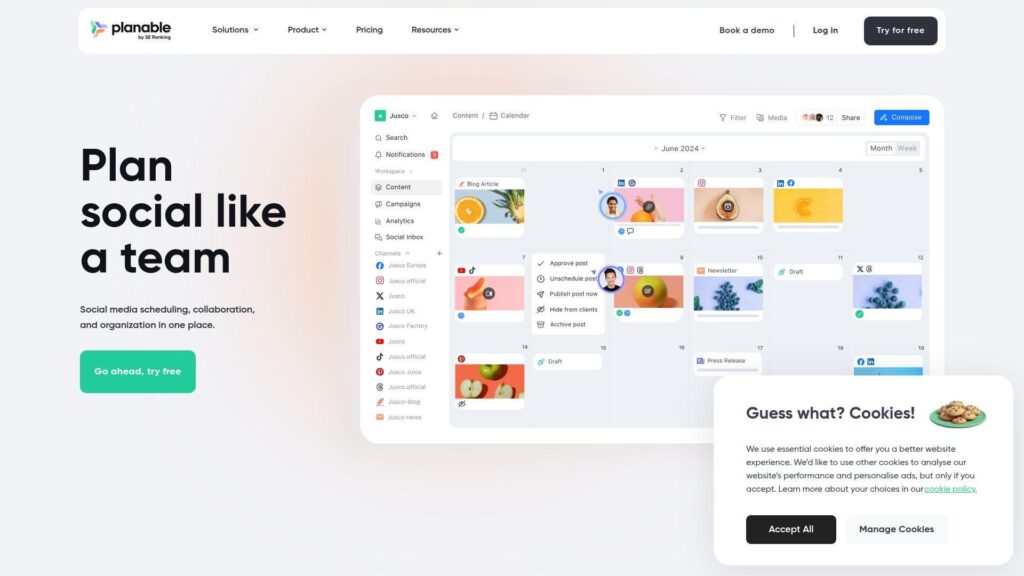
Planable is a collaboration tool for planning and approving social content. The team builds for calm workflows, fewer approvals fights, and clearer publishing accountability.
Tagline: Ship content on time, with approvals that do not derail your week.
Best for: social media teams and agencies managing multi-stakeholder reviews.
- Approval workflows and calendars → reduce last-minute surprises and missed posts.
- Add-on analytics and inbox → cut reporting steps and comment triage time.
- Workspace setup model → reach first approval-ready draft in about 30 minutes.
Pricing & limits: From $0/mo; Trial: free plan is ongoing; Caps: free plan allows 50 total posts lifetime. Basic is $33–$39 per workspace monthly with 60 posts per workspace per month, and Pro supports 150 posts per workspace.
Downside: Costs scale per workspace, which can hurt agencies with many clients. Also, it is not a traffic analytics product without add-ons and integrations.
Verdict: If your goal is smoother publishing and fewer approval bottlenecks, this helps you tighten production within a week. Beats spreadsheets on collaboration; trails full suites on channel performance depth.
Score: 3.8/5
How website traffic analysis tools estimate data and why accuracy varies
1. First-party analytics vs third-party estimates: verified-domain data compared to competitor research
First-party analytics observes your site directly. Third-party tools infer behavior from outside your domain.
That difference is structural, not cosmetic. It changes what “truth” can mean in a report.
We trust first-party tools for operational decisions. Those decisions include campaigns, UX fixes, and capacity planning.
Third-party tools are better for context. They help us avoid narcissism about “our growth” in a shrinking category.
When a team confuses the two, strategy breaks. The cure is simple labeling and disciplined expectations.
2. How traffic estimates are modeled from rankings, search volume, and click-through rates
Most SEO traffic estimates start with rankings. Then they apply expected click curves to predicted impressions.
Those curves vary by query type. Brand terms and “how to” queries behave differently.
We also see SERP layouts distort estimates. Rich results can siphon clicks away from classic links.
Ahrefs, Semrush, Moz Pro, SE Ranking, Sistrix, and Ubersuggest all model this differently. Differences do not automatically mean one is wrong.
In our process, estimates are hypotheses. We validate them with Search Console and with observed landing-page sessions.
3. Organic and paid traffic estimation: separate models for SEO vs PPC visibility
Organic estimation leans on ranking visibility. Paid estimation leans on ad detection, keywords, and creative history.
Paid data is often noisier. Geo targeting and audience targeting can hide ads from many crawlers.
SpyFu can still be useful for directional PPC research. Similarweb also helps when you need high-level channel splits.
We remind teams that paid clicks are not always captured cleanly. Redirect chains and tracking templates can fragment attribution.
A practical safeguard is landing-page auditing. If paid traffic lands, it should be visible somewhere on the server.
4. Geography and localization: interpreting global and country-level traffic trends
Geo estimation depends on data coverage. Panels and datasets can be strong in some regions and thin elsewhere.
Language and device mix also matter. Mobile-heavy markets behave differently than desktop-heavy ones.
We see localization errors mimic market shifts. A wrong hreflang setup can reroute demand across countries.
Country-level competitor trends are still useful. They tell us where a rival invests in content or distribution.
When accuracy is uncertain, we treat geo as an exploration tool. It is a starting point for validation, not a final verdict.
5. Multi-source estimation approaches: combining panels, models, and database cross-references
The best third-party tools rarely use one source. They blend panels, clickstream, crawlers, and public signals.
Blending reduces single-source bias. It can also create overconfidence when a model smooths reality.
We look for transparency in methodology descriptions. Vague “AI estimates” without inputs are a red flag.
Similarweb is a prime example of a multi-signal approach. SEO suites also combine rank data with link and content databases.
In decision meetings, we ask a blunt question. “What would make this estimate wrong?”
6. Bulk analysis at scale: when batch checking changes the workflow and limitations
Bulk analysis is where tooling becomes operations. APIs, exports, and limits suddenly matter more than UI.
At scale, teams stop asking single-domain questions. They ask category questions across many properties.
We see rate limits create accidental sampling. Analysts then build dashboards on incomplete extraction runs.
Our preference is repeatable pipelines with alerting. If extraction fails, stakeholders should know before a board deck ships.
We also encourage a data dictionary. It prevents “sessions” from meaning three different things across tools.
7. Unifying datasets by connecting analytics and search performance sources into one view
Unification is where traffic analytics becomes strategy. It is also where most stacks quietly fail.
Attribution needs consistent identifiers. Campaign tags, content naming, and event schemas must align.
We advise teams to unify around questions, not around tools. A unified view should answer “what changed” and “why now.”
In practice, we connect web analytics, search performance, and behavior evidence. Product analytics then closes the loop on activation.
The result is faster diagnosis. Teams stop arguing about dashboards and start fixing the customer journey.
Website traffic analysis tools workflows: how to analyze competitors and your own site
1. Quick competitor checks: enter a domain, run analysis, and compare multiple sites
A quick competitor check should take minutes. The goal is orientation, not perfection.
We start with Similarweb for traffic posture. Then we use Semrush or Ahrefs for search mechanics.
Next, we scan the competitor’s top pages and channel mix. That reveals whether they win by brand, content, or partnerships.
From there, we write a short hypothesis list. Each hypothesis becomes a test in our own content or campaigns.
The workflow ends with humility. Competitor data is a sketch until validated by your own results.
2. Organic vs paid review workflow: switch filters to evaluate SEO and PPC separately
Mixed reporting hides cause and effect. Splitting organic from paid keeps conversations honest.
In SEO tools, we filter for non-brand opportunities. Brand terms often tell us more about reputation than discoverability.
For PPC, we review landing pages first. Ads are expensive, but broken landing experiences are worse.
SpyFu can reveal historical ad themes. That history hints at what has worked enough to keep running.
We then set an action boundary. Paid fixes are often “today,” while SEO fixes are “this quarter.”
3. Content reverse-engineering: identify top pages, top subfolders, and top subdomains
Reverse-engineering content is not copying. It is learning what demand patterns reward.
We identify the competitor’s traffic centers. Those centers might be blogs, templates, tools, or documentation.
Next, we categorize by intent. Some pages win by education, while others win by comparison and pricing clarity.
In our hosting work, we also check performance traits. Heavy pages often rely on caching, edge delivery, and optimized media.
The outcome is a content blueprint. It includes formats, internal linking patterns, and conversion paths.
4. Keyword intelligence workflow: find organic keywords and paid keywords driving visits
Keyword intelligence starts with constraints. We choose a product line, a geography, and a persona.
Semrush and Ahrefs help us build a seed set. Moz Pro, SE Ranking, Sistrix, and Ubersuggest can expand it.
Then we map keywords to pages. A keyword without a destination becomes a content task or a landing-page revision.
For paid, we check which terms align with high-intent pages. Informational pages rarely convert well for expensive clicks.
Finally, we create measurement rules. Every new page should have a defined success signal.
5. Market opportunity workflow: spot traffic gaps across channels, keywords, and backlinks
Opportunity is often a gap between intent and supply. Traffic tools help us see those gaps quickly.
We look for keywords where competitors rank, but we do not. Next, we check whether our site has credible content coverage.
Backlink gaps often explain stubborn ranking gaps. Ahrefs and Majestic are helpful when we need to validate link quality signals.
We also look for channel gaps. If competitors win via referrals, partnership strategy might beat another blog series.
The workflow ends with prioritization. We pick the smallest set of moves with the highest compounding value.
6. Behavior analytics workflow: use heatmaps, session recordings, and funnel views for UX insights
Behavior analytics should answer “where friction lives.” It should not become voyeurism.
We start with a funnel view in analytics. Then we jump into visual tools for the pages with drop-offs.
Crazy Egg, Microsoft Clarity, Hotjar, FullStory, Contentsquare, Mouseflow, and Lucky Orange can all surface friction. Choice depends on governance and scale needs.
Next, we tag patterns. Common patterns include confusing navigation, weak CTAs, and forms that fail silently.
We finish with a change log. Every UX change should link to an observed behavior, not a personal opinion.
7. Reporting workflow: dashboards, automated email reporting, and AI-friendly traffic summaries
Reporting is a product for decision-makers. It needs clarity, stability, and explicit definitions.
We prefer weekly rhythms for strategy and daily rhythms for operations. That split reduces reactive behavior.
Good dashboards highlight anomalies and drivers. They avoid clutter and focus on a few business-critical narratives.
AI summaries help when they cite underlying segments. “Traffic is up” means nothing without the source and landing pages.
Our best reports end with actions. Owners, deadlines, and expected impact keep analytics from becoming theater.
Must-have features checklist for choosing website traffic analysis tools
1. Traffic and engagement reporting: visitor trends and performance snapshots
Start with trend clarity. A tool should make it hard to misread direction.
- Clear time comparisons with stable definitions.
- Bot filtering and internal traffic exclusions.
- Landing page and exit page visibility.
We also want fast exploration. Slow analytics UIs quietly kill curiosity inside teams.
2. Channel breakdowns: acquisition reports and traffic-source visibility
Channel breakdowns must reflect your marketing reality. Otherwise, every meeting becomes an attribution argument.
- Flexible channel grouping rules.
- Campaign tagging support and governance.
- Referrer visibility with sane defaults.
In our experience, channel hygiene pays back quickly. It reduces blame and accelerates fixes.
3. Competitor comparison: benchmarking, market share, and side-by-side analysis
Competitor tools are essential for context. They prevent teams from confusing category growth with personal brilliance.
- Multi-domain comparison in one view.
- Industry categories and peer sets.
- Channel mix estimation with methodology notes.
We also look for change detection. Alerts beat manual “checking the graphs” every morning.
4. SEO insights: organic keyword reports, top keywords, and content discovery
SEO insights need depth and explainability. Keyword lists are cheap, but keyword intent is not.
- Keyword grouping and intent classification.
- SERP feature visibility and cannibalization hints.
- Content discovery tied to actual queries.
We favor tools that connect keywords to pages. That keeps strategy grounded in deliverables.
5. PPC insights: paid keyword research, ad history, and traffic cost context
Paid insights should shorten the loop from idea to test. They should also reduce waste.
- Ad copy history and theme clustering.
- Paid keyword discovery by competitor.
- Landing-page mapping for paid terms.
SpyFu is often helpful in the early phase. Still, we validate with real campaign outcomes.
6. Geographic analysis: country distribution and regional trends over time
Geo reporting is both marketing intelligence and infrastructure guidance. It should be easy to trust.
- Country and city breakdowns with filters.
- Device and browser splits by region.
- Localization support for multi-language sites.
We also want exportability. Geo insights are often used by sales and support teams too.
7. Top pages reporting: best-performing content and sections driving traffic
Top pages drive budgets, editorial calendars, and internal politics. The tool should reduce guesswork.
- Page groups for folders and templates.
- Landing-page segmentation by channel.
- Search query linkage where possible.
We encourage teams to track content decay. A page that slowly fades can be revived cheaply.
8. Custom reporting: goals, events, custom dimensions, and tailored dashboards
Custom reporting is where “analytics” becomes “measurement.” It is the difference between observation and control.
- Flexible event schemas and naming rules.
- Goal definitions tied to business outcomes.
- Custom dimensions for segmentation.
At 1Byte, we treat naming as engineering. Bad names create bad decisions at scale.
9. Automation options: APIs, bulk checks, and scalable agency workflows
Automation is the only way to keep reports consistent. It also protects analysts from repetitive work.
- APIs for extraction and scheduled jobs.
- Bulk domain and keyword workflows.
- Role-based access and audit trails.
We like tools that fail loudly. Silent partial exports are a reporting disaster.
10. Integrations and connectors: marketing, ecommerce, and reporting stack compatibility
Integration depth decides whether a tool becomes central. Without connectors, analytics stays isolated and underused.
- Ad platform and email platform integration support.
- Ecommerce events and revenue tracking options.
- Webhook or export pathways for BI tools.
Our rule is pragmatic. If integration takes weeks, adoption usually collapses.
11. Behavioral analytics add-ons: heatmaps, polls, session recordings, and funnel insights
Behavior tools should complement analytics, not replace it. They turn “what” into “why” when used responsibly.
- Element masking and privacy controls.
- Funnels paired with replay evidence.
- Collaboration features for UX triage.
We also prefer tools with clear retention controls. Unlimited recording without governance is a liability.
Privacy, compliance, and data ownership considerations in website traffic analysis tools
1. Data ownership vs shared advertising ecosystems: what “not privacy-friendly” can imply
Some analytics tools monetize through advertising ecosystems. That can create incentives that conflict with customer trust.
We do not think privacy is only legal risk. It is brand risk, procurement risk, and security risk.
Tools like Matomo, Plausible, Fathom Analytics, Simple Analytics, and Umami appeal because ownership is clearer. Cloudflare Web Analytics also resonates when teams want fewer third-party scripts.
That said, “privacy-friendly” is not magic. Configuration, consent choices, and governance still decide outcomes.
We recommend writing down a data ownership position early. It prevents surprise debates during audits.
2. Cookie consent requirements and measurement gaps: accuracy and UX tradeoffs
Consent changes measurement. It can reduce visibility, especially on jurisdictions with strict consent expectations.
We see teams respond in two bad ways. Some ignore consent, and others stop measuring altogether.
A better approach is designing for known gaps. Trend analysis, server-side validation, and clearer conversion proxies can help.
We also advise measuring the consent experience itself. A confusing banner can reduce conversion more than the tracking is worth.
In our hosting work, performance matters here. Slow banner scripts can delay rendering and frustrate visitors.
3. Privacy-friendly analytics approaches: options designed for reduced reliance on cookies
Privacy-friendly analytics often means less identity stitching. That is not a weakness if your questions are realistic.
For content-heavy sites, page-level and referrer-level answers are usually enough. For product funnels, you may need event schemas and careful consent design.
We often pair a lightweight analytics tool with a product analytics tool. That avoids forcing one system to do everything.
When teams want minimal scripts, edge-based measurement can help. It also reduces client overhead and improves performance predictability.
We like privacy-friendly stacks because they reduce future churn. Regulations and browser changes keep moving the goalposts.
4. Compliance requirements: GDPR, LGPD, HIPAA, CCPA, ePrivacy, and PECR considerations
Compliance is not a checkbox. It is an operating model across marketing, product, and infrastructure.
GDPR enforcement can be severe, including fines up to 4 % of worldwide turnover for certain violations, so measurement design deserves executive attention.
We encourage teams to involve legal early. The worst time to learn a tool is unacceptable is after deployment.
Data processing agreements, retention settings, and access policies should be explicit. Hidden defaults create audit panic later.
At 1Byte, we also push for least-privilege access. Analytics data can expose sensitive business strategy.
5. Behavioral analytics privacy: managing session recordings and heatmaps responsibly
Session recordings are powerful evidence. They are also easy to misuse.
We advise strict masking policies for forms and user inputs. Teams should also document who can view recordings and why.
For sensitive industries, we recommend extra caution. A replay tool should never become a shadow customer database.
Retention should be intentional. Keeping recordings “forever” is rarely necessary for UX improvement.
When governance is solid, behavior tools become a competitive advantage. They reduce opinion-driven design and shorten iteration cycles.
1Byte web hosting support for website traffic analysis tools as an AWS Partner
1. Domain registration and SSL certificates: secure setup for trustworthy tracking and visitor confidence
Measurement depends on trust. Visitors will not engage deeply on a site that feels unsafe.
At 1Byte, we start with clean domain hygiene and strong encryption. That reduces browser warnings and improves attribution stability.
We also prefer consistent canonicalization. Multiple hostnames can split analytics and break SEO signals.
Secure configuration helps with tracking integrity. It reduces spoofing and limits interception risks.
When customers ask why this matters, we answer plainly. Trust is a conversion feature, not a bonus.
2. WordPress hosting and shared hosting: reliable performance foundations for consistent analytics data
Analytics quality depends on site performance. Slow pages distort engagement, inflate exits, and bias funnel data.
On WordPress, we see plugin bloat create noisy measurement. A single heavy script can change bounce patterns overnight.
Shared hosting can work for early-stage sites, but variability can confuse trend analysis. Stable hosting creates stable baselines.
We help customers reduce variability with caching strategies and careful resource planning. Cleaner delivery produces cleaner analytics.
Once the baseline is stable, tools like Google Analytics, Matomo, or Plausible become far more trustworthy.
3. Cloud hosting and cloud servers with 1Byte: scalable infrastructure guidance from an AWS Partner
Traffic growth should not trigger firefighting. It should trigger planned scaling.
As an AWS Partner, we help customers design infrastructure that tolerates spikes. That includes smart caching, safe deployments, and observability.
We also advise teams to treat analytics tags like production code. Changes should be tested, versioned, and rolled back when needed.
When measurement and infrastructure align, growth becomes measurable and repeatable. That is the point of the stack.
If we were building your stack tomorrow, which question would you want answered first: “where demand comes from,” or “why visitors do not convert?”